Brokers are once again bullish on BHP (ASX: BHP), despite the shares underperforming the market during the last couple of weeks. Twelve-month targets average near the $30 mark, suggesting some decent upside from here. However, do we need to be worried about BHP’s recent underperformance? What do the charts say about BHP? Is $30 a realistic target, or are we going to see the share price continue to slide?
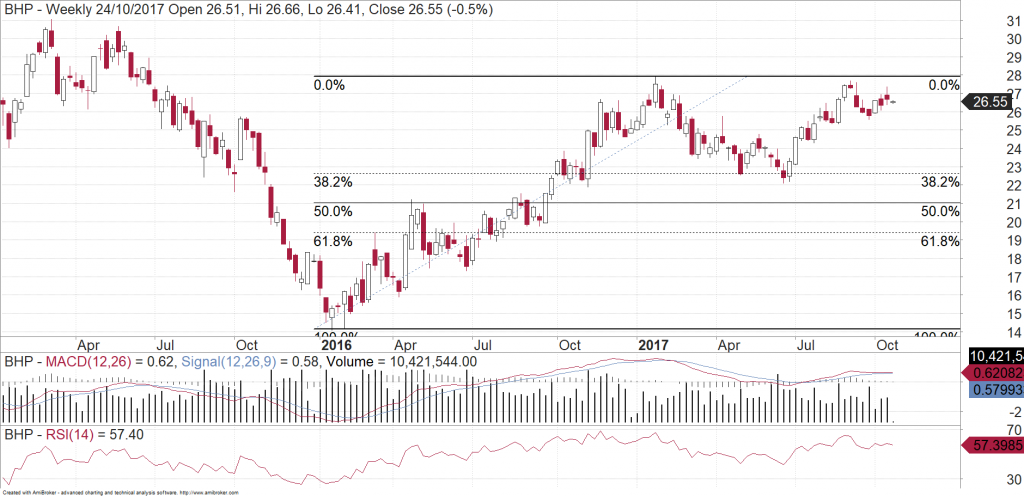
One interesting feature of BHP that we noticed is the way it generally likes to respect the 38.2% Fibonacci retracement. If we have a look at the rally from early 2016 to early 2017 and overlay that with our Fibonacci tool, you will notice that give or take a few cents, BHP’s correction managed to find support at the 38.2% retracement.

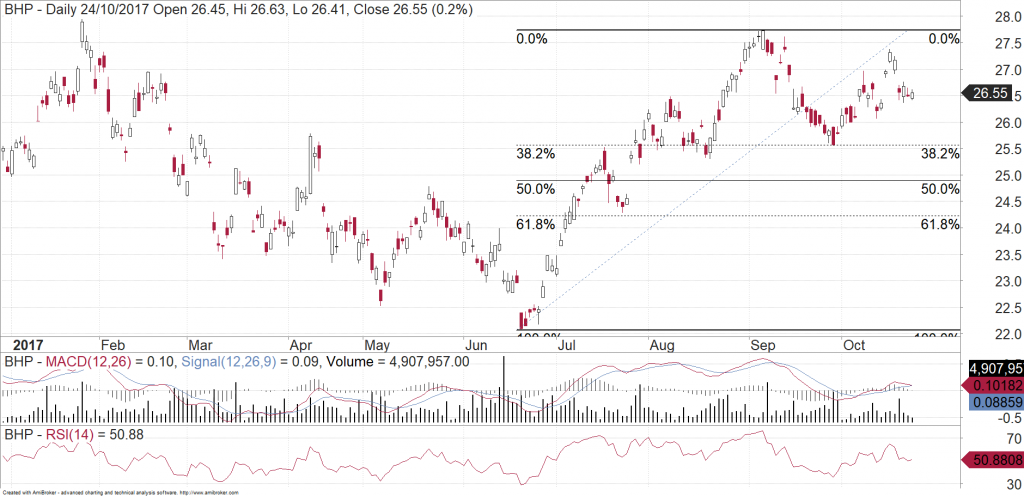
After it rallied from that point, we then measured that rally from the June low to the September high. Once again, the recent correction in the share price found support at the 38.2% retracement level.

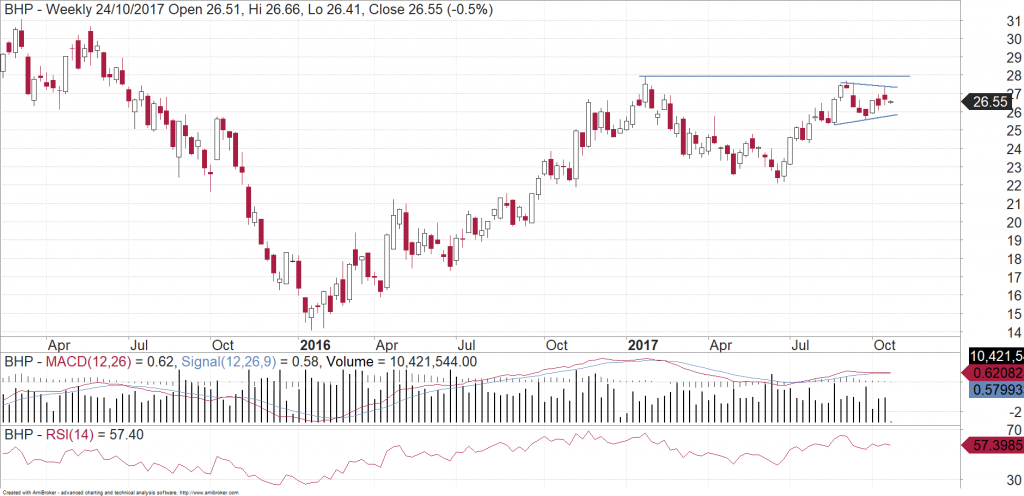
Coming back to the overall picture for BHP, what we like about this chart is the fact that after the shares rallied in June, they stopped short of the January peak. This is bullish because it means that the stock is now going to use up some time here to allow the sellers to dump their stock and let it change hands to those who see some further upside. This means that BHP is likely to either drift sideways here to form a little triangle, or it may even make a little “abc” correction back towards $25. Either way, once it has used up a bit more time here and eliminated the bears, it will be ready to break the January high. With selling resistance mostly eliminated, it should then be able to rally quite freely towards $30 or beyond.

As much as brokers can get it wrong with their commodity price targets, it looks as though the fundamental and technical aspects are signing from the same hymn book.
More information on BHP:
For more information on Fibonacci retracements, click here
Michael Gable is managing director of Fairmont Equities.
Sign up to our newsletter. It comes out every week and its free! You can leave your email with us via the form on the right-hand side of this page.
Disclaimer: The information in this article is general advice only. Read our full disclaimer HERE.
Like this article? Share it now on Facebook and Twitter!

