Who was Fibonacci?
Guglielmo Fibonacci was an Italian mathematician born in Pisa, Italy in 1175AD who introduced the Fibonacci numbers. He has been hailed as the greatest European mathematician of the middle ages. When Fibonacci was young, he travelled with his father who was a merchant through the Eastern Mediterranean and North Africa. It was during his travels that he met with many other merchants and learnt the Hindu-Arabic numeric system. He published his first book titled “Liber Abaci” and introduced the Arabic numerals 0 through 9 which formed the basis of a decimal system. This new system made addition, subtraction, multiplication and division a lot easier than the old Roman numerals. In this book he also introduces the simple numerical sequence of numbers 0,1,1,2,3,5,8,13,21,34,55,89,144 which are the foundation of mathematical relationship behind phi. Each number is the sum of the two numbers before it, that is , (0+1=1, 1+1=2). The ratio of each successive pair of numbers in the sequences approximates Phi (1.618), that is, 5 divided by 3 is 1.666, 8 divided by 5 is 1.60.
Fibonacci in nature
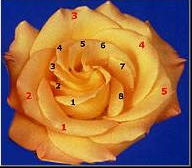
This Fibonacci sequence is found widely in nature. For example, in the below picture of a rose, it starts with 8 petals in the first sequence (in blue) and then the next sequence has 5 petals (numbered in the red).

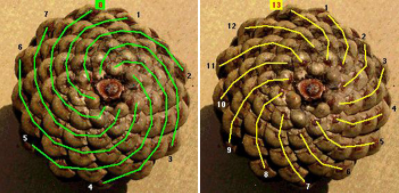
In the below picture of a pinecone, you can see it has 8 (green) spirals going clockwise and 13 (yellow) spirals going anti clockwise. These are Fibonacci numbers.

Trading with the Fibonacci Retracements
Traders have used these Fibonacci numbers to come up with Fibonacci retracements. These are technical tools used by traders to determine possible support or resistance levels. Support levels means the price where the stock won’t fall any further. A resistance level means the price ceiling of where prices can’t go any further.
In technical analysis the key Fibonacci ratios are 23.6%, 38.2%, 50%, 61.8% and 100%.
The 61.8% number is derived by diving one number in the series by the one that is following it, that is, 89/144, 34/55
Uniquely combining both Fundamental and Technical Analysis
Not yet a subscriber? Join now for FREE!
Receive our weekly tips and strategies into your inbox each week.
BONUS: Sign up now to download our 21 page Trading Guide.
The 38.2% is calculated by dividing one number in the series by two numbers in the series after, that is, 34/89, 55/144
The 23.6% ratio is calculated by dividing one number in the series by three numbers after in the series, that is, 21/89, 34/144
The 50% ratio is not a Fibonacci number but traders use it when finding support and resistance levels.
Prices tend to move in cycles and this Fibonacci retracement tool is good to use to estimate when the following pullback is likely to stop and when the trend will resume.
Traders will wait for the 23.6% and 38.2% retracements in bullish markets before the uptrend takes place again.
Traders who are looking to enter the stock at the bottom of the market will wait for 50%, 61.8% retracement levels for a pullback.
The Fibonacci number of 0.618 has been named the “Golden Ratio” as it has been one of the most consistent entry points
Example of Fibonacci Retracement
In the example below, we can see on the daily chart of BHP that the in the recent rally where the stock was at $27.50, the price fell but it found support in the 38.2% retracement level, then had another rally and found support again in the 23.6% retracement level.
These Fibonacci retracement levels can be useful to use when deciding entry points and exit points.

Source: Amibroker
Lauren Hua is a private client adviser at Fairmont Equities.
Sign up to our newsletter. It comes out every week and its free! You can leave your email with us via the form on the right-hand side of this page.
Otherwise you can email us at mail@fairmontequities.com
Disclaimer: The information in this article is general advice only. Read our full disclaimer HERE.
Like this article? Share it now on Facebook and Twitter!

