
Pact Group Holdings (PGH) is a provider of consumer and industrial packaging solutions in Australasia and Asia. The Company operates across seven countries and is the largest supplier of rigid plastics packaging in Australia and NZ, with an estimated 40% market share. PGH specialises in the manufacture and supply of: rigid plastic and metal packaging; materials handling solutions and recycling and sustainability services. The Company has two operating divisions: Pact Australia, which generates ~60% of group EBIT, and Pact International.
A complement and addition to the core business has been contract manufacturing services, after the Company’s recent expansion into this area. This has been via the acquisition of three businesses: Jalco in September 2015, Australian Pharmaceutical Manufacturers (APM) in and September 2016, and Pascoe’s Group in February 2017.
Whilst we consider the expansion into contract manufacturing to be strategically sound, contract wins and strong volume growth in the latter continues to be offset by generally subdued demand for rigid packaging. This is particularly in the dairy, food and beverage sectors. In addition, the Company is incurring start-up costs for new contracts manufacturing work secured.
In the key Pact Australia division, earnings are largely driven by contributions from acquisitions and cost savings. However, these are being offset by challenging conditions in rigid packaging. This is resulting in significantly lower volume and increased competition in some sectors.
Excluding acquisitions, underlying EBIT was down 5%, which is disappointing given that the Company only updated FY17 guidance in May for organic earnings to be generally flat on the prior year.
The share price performance was once strong and this relied on growth from acquisitions to complement strong organic growth in the core business, which at present, is clearly lacking.
What do the charts now have to say?
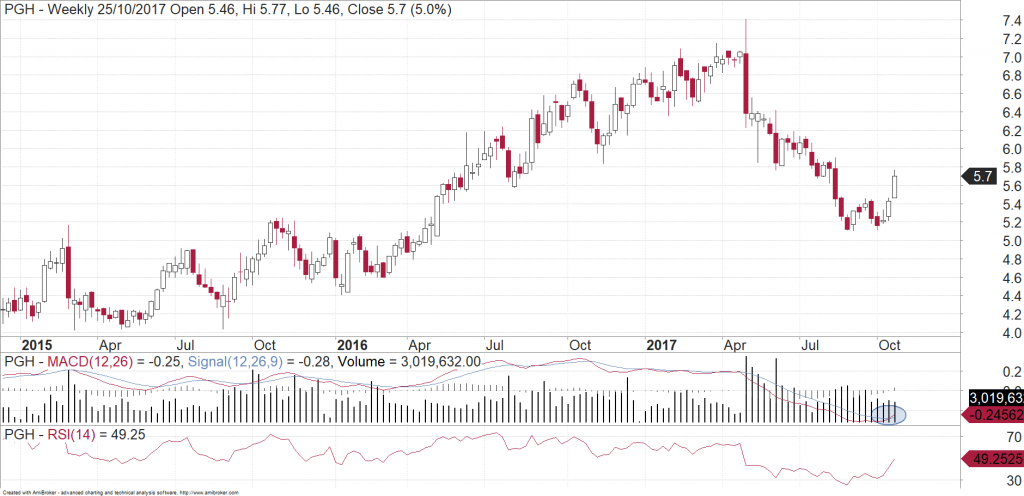
The large sell-off in May gave us a classic reversal signal on the weekly candlestick chart. The stock then proceeded to be sold down, finding a low in September at $5.11. Since then, the stock has made a higher low and then the last two weeks have been particularly bullish. You will also notice the buy signal getting generated on the weekly MACD (circled). This means that the stock is likely to head higher here, at least in the short term.
Given the challenges mentioned above, it is too early to say whether the stock can get back into a long term uptrend. But for holders of the stock, the chart at least shows a bit of respite from the recent red ink.
Michael Gable is managing director of Fairmont Equities.
Sign up to our newsletter. It comes out every week and its free! You can leave your email with us via the form on the right-hand side of this page.
Disclaimer: The information in this article is general advice only. Read our full disclaimer HERE.
Like this article? Share it now on Facebook and Twitter!