
This post formed the basis of an article which then appeared in the Australian Financial Review on 6 April 2016. Michael Gable is a regular expert contributor to the AFR. You can access the AFR version HERE.
Over the past two years, there has been a lot of press about Woolworths’ problems, especially its disastrous venture into hardware with its Masters stores.
But while Woolworths was shooting itself in the foot, you would expect its major competitor Wesfarmers to be cashing in on the retailer’s mistakes. Instead, in the last few years, the Wesfarmers share price has gone nowhere.
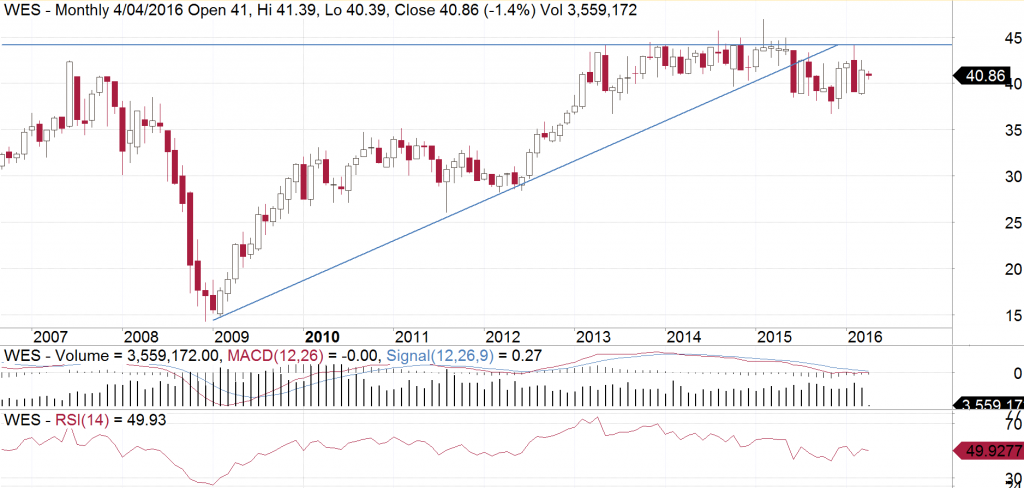
Every time the share price gets near $44, the sellers step in.
When I have a look at a long-term monthly candlestick chart, I can see some other problems with the way it is trading. Firstly, the upside momentum in the share price, as measured by a monthly metric, its relative strength index, has been decreasing since 2013. So while the share price stays up at the same levels, it creates divergence between the two. Often this will mean that the price needs to catch up and go for a bit of a dip as well.
Another interesting note is if I was to draw an uptrend line from the GFC lows, we can see that Wesfarmers fell through that last year. Not only that, but it did so very sharply – and on strong volume as well. Since then the stock has failed to get back above this uptrend line, getting sold off sharply again when it gets near that key $44 region. This means that from a charting perspective, I can only see problems with the share price.
If Wesfarmers couldn’t see a share price increase while Woolworths presented them with opportunities on a silver platter, I wonder what would happen to the Wesfarmers share price once Woolworths gets their act together. And what if Aldi continues to make inroads in the supermarket sector and the Bunnings expansion in Britain hits an inevitable road bump? These could all be the catalysts for the Wesfarmers share price to head backwards.
I have recommended selling Wesfarmers on any rallies. Otherwise my advice is to keep a close eye on it. If we continue to see weakness, then the charts suggest that a level down near $34 is where it could head to before we find some major support coming in.
Disclaimer:
Michael Gable is an Authorised Representative (No. 376892) and Fairmont Equities Pty Ltd is a Corporate Authorised Representative (No. 444397) of Novus Capital Limited (AFS Licence No. 238168).
The information contained in this report is general information only and is copy write to Fairmont Equities. Fairmont Equities reserves all intellectual property rights. This report should not be interpreted as one that provides personal financial or investment advice. Any examples presented are for illustration purposes only. Past performance is not a reliable indicator of future performance.
No person, persons or organisation should invest monies or take action on the reliance of the material contained in this report, but instead should satisfy themselves independently (whether by expert advice or others) of the appropriateness of any such action. Fairmont Equities, it directors and/or officers accept no responsibility for the accuracy, completeness or timeliness of the information contained in the report.
All share price charts are courtesy of AmiBroker, unless stated otherwise.