
This post formed the basis of an article that appeared in the April edition of the ASX Investor Update on 12 April 2016. Michael Gable is a regular expert contributor to the ASX. You can access the ASX version of the article HERE.
What the share-price charts say about Woodside, Santos, Oil Search and Caltex.
Energy stocks were being viewed by some as great buying opportunity a year ago because of the plunging oil price. Yet despite the recent relief rally, the oil price is still 60 per cent below where it was two years ago.
Demand for oil is generally OK, but the supply is too large to sustain an increase in price. When the US started to invest heavily in shale gas, OPEC felt the need to protect its interests by seeking to crush these new US producers, which had higher costs compared to OPEC producers.
OPEC reasoned that if it could flood the market with supply, the price would drop and drive the US producers out of business. It would also dissuade new investment. That done, OPEC could ease back supply and allow the price to head higher again.
Look at the iron ore market to see parallels of what a supply increase can do and how it can drag on longer than many expect.
While OPEC keeps the supply up, the price of oil is going to stay low. There have been movements up and down in oil because of other factors. These include Chinese economic growth concerns, Iran now supplying the market and US producers starting to cut back on investment.
These factors have contributed to the short-term volatility of the oil price but none have resulted in a sustained movement in either direction.
Another factor to bear in mind is what energy companies are doing in the face of lower prices. They are undergoing huge cost savings and driving efficiencies to protect margins, and this will reduce the long-term price of oil as companies become more resilient.
The price of oil seems to have stabilised for now, so while there are reasons for it to have bottomed, we do not know when it will go up. This will not necessarily translate into a bottom for the prices of energy stocks, because they are pricing in higher oil prices over time. If oil takes longer than expected to recover, stock prices will need to factor that in and could therefore fall further.
Watch the charts
Share-price charts for the major Australian energy companies can help determine where they can go from here. In this article I have chosen Woodside Petroleum (WPL), Oil Search (OSH), Santos (STO) and Caltex (CTX).
Woodside is the largest listed energy stock on ASX, the one many incorrectly dubbed a “yield play” recently because of a brief period of paying good dividends. As the lowest-cost producer among the majors with some cash on the balance sheet, Woodside is best positioned to take over distressed assets.
Oil Search received an acquisition proposal last year from Woodside but it changed its mind. Oil Search lists the PNG Government as a major partner, which is a strength but also a weakness when larger firms look at its takeover prospects.
Santos has supposedly been a takeover target for as long as I can remember but its high debt levels have caused some investors recently to avoid it. However, the astute trader knows that the highly leveraged plays can make fantastic strides when recovery does take place.
As for Caltex, the unique thing about this company is that by backing away from refining, it is more like a retailer now in an environment where the product is in high demand and the costs are going down. Caltex’s recent share performance reflects these characteristics.
The charts of each stock reveal the following:
1. Woodside Petroleum
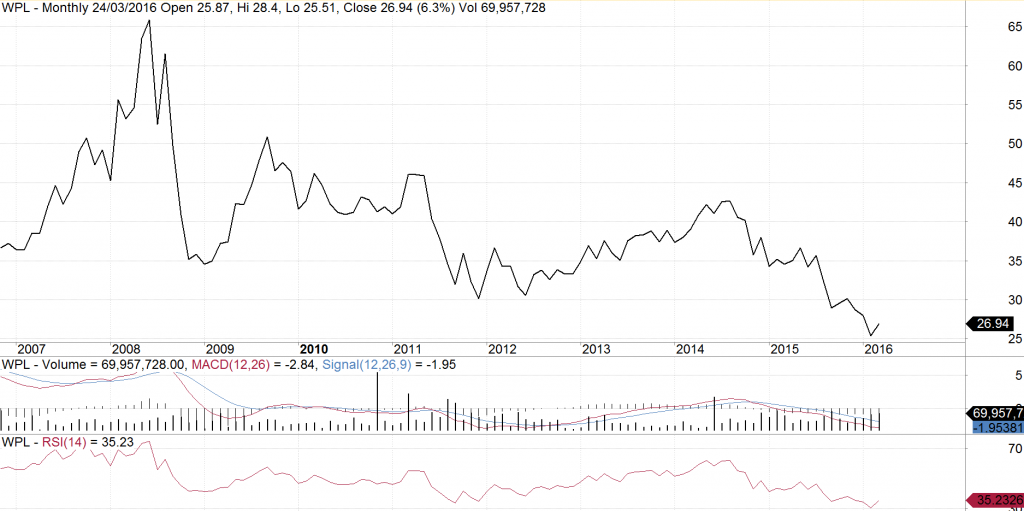
We warned clients for a while now that Woodside will retest the GFC lows and that finally happened in the past few months. Expect some volatility as the market figures out where the stock should head.
Momentum indicators show a slowing down in the downtrend that started almost two years ago. Most likely, Woodside will build a base here (sideways move) while the oil price sorts itself out. But if the future oil price assumptions take a dive, Woodside will not be immune from another quick drop, to the low $20s.
2. Oil Search
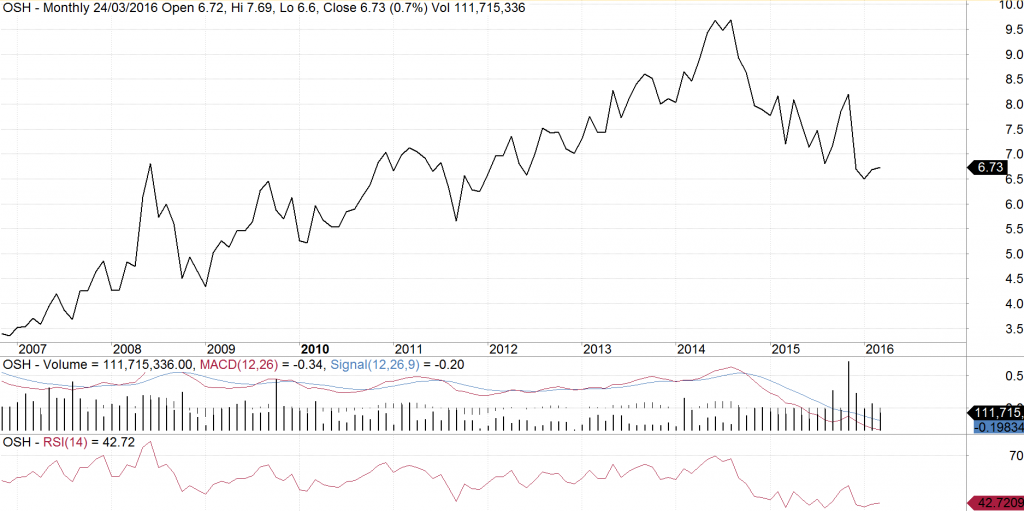
Oil Search would need to halve in value to retest the GFC lows. To some, this can seem contrary to the idea that Woodside, as the market’s largest energy stock, is not holding up better than Oil Search during the recent sell-off.
When Woodside made a bid for Oil Search last year, I advised clients to sell into that strength. The deal fell through but that is not to say corporate activity in Oil Search is dead.
The chart, like Woodside’s, shows the selling momentum to be decreasing. Unlike Woodside, however, I cannot see any potential for base-building just yet. The volatility is high and Oil Search is, to some extent, still factoring in a potential takeover. I see potential for the stock to drop back into the $5 range again where some good support exists near $5.
3. Santos
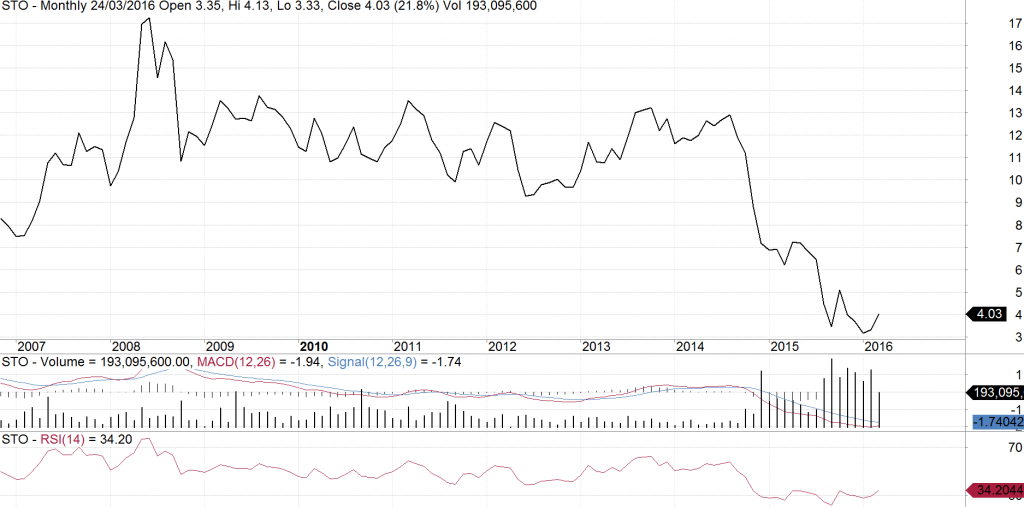
Santos’s key issue with debt has been reflected in price movements since the oil price collapsed. It has suffered falls much larger than Woodside and Oil Search, and is now trading at less than half its GFC low.
If Santos is analysed using a monthly candlestick chart (not shown here), and measuring the bodies of the candles, it appears to have completed a neat 3-wave decline from the 2008 high. That may be lost on anyone not familiar with Elliott Wave analysis, but it essentially means this could be a low point for Santos. It is also showing signs of slowing momentum, so much so that we are almost getting buy signals for the longer term.
Because of the problems predicting when the oil price will bounce, we cannot tell if Santos will bounce strongly here or not. But even if it tracks sideways for a while, that low in January this year will take quite a bit of bearishness to surpass.
4. Caltex Australia
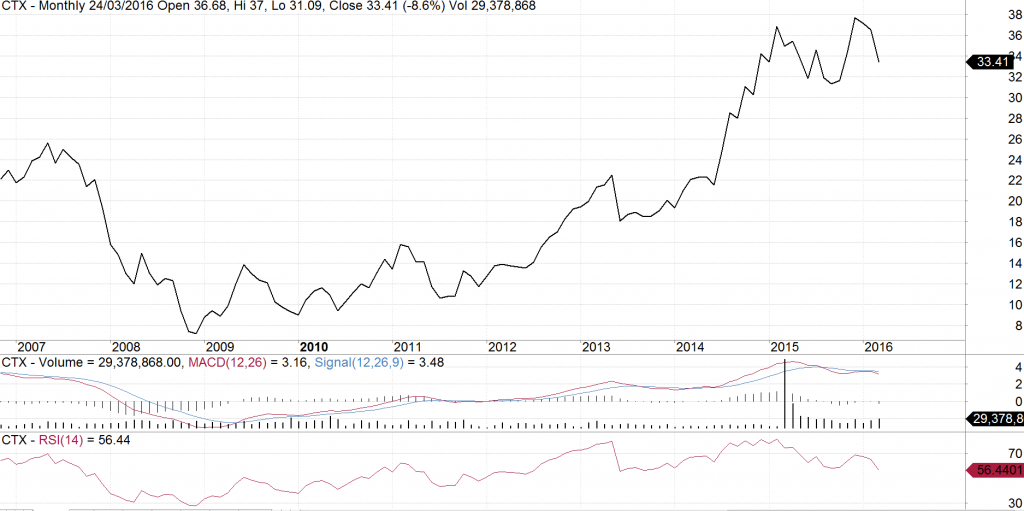
When the oil price plunged in 2014, energy stocks went with it. Caltex, however, is trading nearly 50 per cent higher. Understanding the difference between Caltex and the other three stocks has made some investors wealthy.
The only issue we see now with the chart is that at the end of 2015, Caltex went to retest its high earlier in the year, only for it to be sold down sharply. This “double top” on the chart should be viewed with caution. Although the stock looks cheap fundamentally, we can see the possibility of it heading back to the long-term uptrend line near $28 at some point this year.
Caltex’s outperformance leads to a key point: instead of viewing cheap oil as an opportunity to buy cheap energy stocks, flip that idea on its head; find stocks that benefit from cheap oil. The oil price has done wonders for Qantas; and when the oil price started falling, Toll Holdings, a large user of fuel, was taken over at a huge premium and exited ASX.
Another sector that could benefit from cheap transportation and airfares is, of course, tourism. The likes of Ardent Leisure, Mantra Group, The Star Entertainment Group and Village Roadshow, to name a few, could be worth looking into.
Disclaimer:
Michael Gable is an Authorised Representative (No. 376892) and Fairmont Equities Pty Ltd is a Corporate Authorised Representative (No. 444397) of Novus Capital Limited (AFS Licence No. 238168).
The information contained in this report is general information only and is copy write to Fairmont Equities. Fairmont Equities reserves all intellectual property rights. This report should not be interpreted as one that provides personal financial or investment advice. Any examples presented are for illustration purposes only. Past performance is not a reliable indicator of future performance.
No person, persons or organisation should invest monies or take action on the reliance of the material contained in this report, but instead should satisfy themselves independently (whether by expert advice or others) of the appropriateness of any such action. Fairmont Equities, it directors and/or officers accept no responsibility for the accuracy, completeness or timeliness of the information contained in the report.
All share price charts are courtesy of AmiBroker, unless stated otherwise.