This post formed the basis of an article which then appeared in the Australian Financial Review on 30 March 2016. Michael Gable is a regular expert contributor to the AFR. You can access the AFR version HERE.
The price of oil seems to have stabilised for now so while there are arguments for it to have seen the lows, we don’t know when it will actually go up.
As long as OPEC keeps up the supply, the upside for oil is going to be limited. This won’t necessarily translate into a bottom for the prices of energy stocks.
This is because energy stocks are pricing in higher oil prices over time.
If oil takes longer than expected to recover, then stock prices will need to factor that in and could therefore fall further.
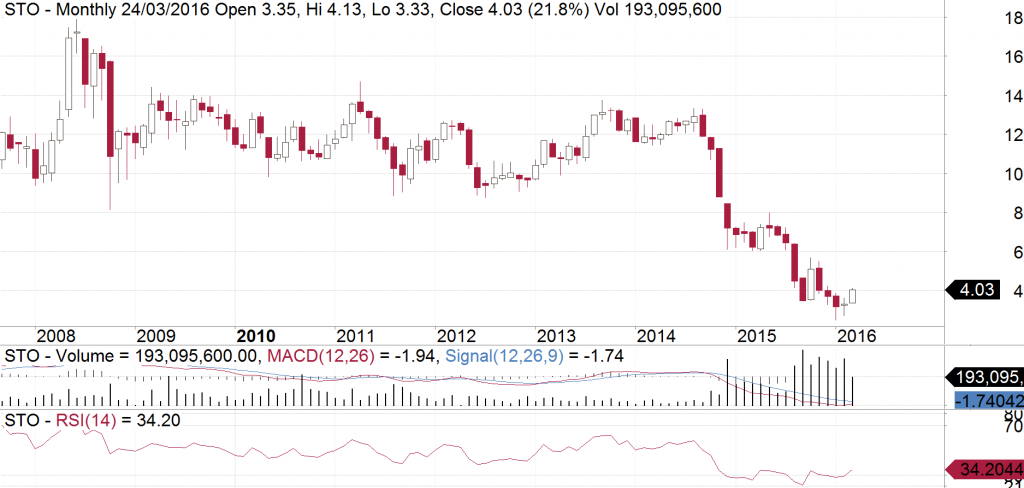
So while I am not recommending my clients purchase stocks like Santos (STO) yet, I can see evidence that the selling is subsiding.
Uniquely combining both Fundamental and Technical Analysis
Not yet a subscriber? Join now for FREE!
Receive our weekly tips and strategies into your inbox each week.
BONUS: Sign up now to download our 21 page Trading Guide.
A combination of falling oil prices and high debt levels has seen many investors recently run for the exit. However, the astute trader knows that the highly leveraged plays can make fantastic strides when that recovery does take place.
Santos is now trading at less than half its GFC low and less than a quarter of its pre-GFC high.
If I analyse Santos using a monthly candlestick chart, it appears as though it has come back from the 2008 high a neat 3 wave decline.
Stock will often correct back in 3 waves, or an “abc” correction.
Often wave “c” is about 1.61 times the size of wave “a” according to Elliott Wave analysis.
This means that we could now be at a low point for Santos. It is also showing signs of slowing momentum to the extent that we are almost getting buy signals for the longer term.
Because of the problems mentioned earlier with predicting when the oil price will bounce, we cannot tell if Santos will bounce strongly here or not. But even if it tracks sideways for a while, I am getting confident that the low seen in January this year should now hold.

Disclaimer:
Michael Gable is an Authorised Representative (No. 376892) and Fairmont Equities Pty Ltd is a Corporate Authorised Representative (No. 444397) of Novus Capital Limited (AFS Licence No. 238168).
The information contained in this report is general information only and is copy write to Fairmont Equities. Fairmont Equities reserves all intellectual property rights. This report should not be interpreted as one that provides personal financial or investment advice. Any examples presented are for illustration purposes only. Past performance is not a reliable indicator of future performance.
No person, persons or organisation should invest monies or take action on the reliance of the material contained in this report, but instead should satisfy themselves independently (whether by expert advice or others) of the appropriateness of any such action. Fairmont Equities, it directors and/or officers accept no responsibility for the accuracy, completeness or timeliness of the information contained in the report.
All share price charts are courtesy of AmiBroker, unless stated otherwise.
