The extent and timing of a likely cooling in the domestic housing market is a hot topic of discussion at present and is the main factor that underpins the outlook for REA Group (ASX:REA).
We recently research the Company after it reported financial results for the six months to 31 December 2021 (1H22). The negative share price reaction since reflects the fact that the Company expects a slowdown in residential listings in the current June half. They also provided higher-than-expected cost growth guidance. Has the market overacted, or is there further downside risk to the share price?
About REA Group
The Company operates the leading online property classified listing website in Australia (realestate.com.au). It attracts 3.3x more visits than its nearest competitor and was recognised as one of Australia’s top 10 online brands, ranking 7th as of December 2021.
Key Fundamental Drivers
What is the Outlook for Listing Growth?
The key metric underpinning the outlook is the rate of growth for listings. Over 85% of group revenue is generated from the domestic business, which comprises of new listings and depth advertising. Whilst domestic listings continue to remain buoyant (January listings were +14%), REA remains somewhat cautious about the volume outlook in 2H22. This is given the impact of the Federal Election in 4Q22 on residential listing volumes and the potential for regulatory intervention to curb rapid house price rises. Elections generally see a weak listings environment for 1-2 months.
Generally speaking, accurately forecasting listing volumes remains difficult. In addition, listings are expected to be volatile over the course of 2H22. While growth of ~10% is expected in 3Q22, this is expected to revert to negative growth in 4Q22.
Operating Leverage Remains – Despite Higher Cost Growth Guidance
Operating leverage at the group level has been evident over the last several years. The Company has demonstrated an ability to flex costs up and down due to the variable nature of the cost base. The expansion in EBITDA margins (excluding acquisitions) in 1H22, with revenue growth of 25% exceeding core operating expense growth of 17%, demonstrates that operating leverage remains evident.
The Company increased cost growth guidance from high single digit to low double-digit growth. They attributed this to higher revenue-related variable costs. In context, operating leverage across the group, excluding the impact of REA India and Mortgage Choice, is expected to remain. REA is still forecast to generate a 60% EBITDA margin in its core Australian business. It is worth noting that an element of REA’s cost growth appears to be around discretionary hiring due to the strong revenue environment. In particular, higher staff costs were due to higher headcount and salaries in a tight labour market.
Importantly, REA has levers to pull in a scenario where wage inflation becomes an issue, hence operating leverage is likely to remain over the medium term.
Can Further Penetration in Depth Advertising Offset a Decline in Listings?
REA has three depth products: Premiere, Highlight and Feature. The highest-yielding listing product, Premiere continues to outperform, with a sizeable increase in penetration demonstrating the superior returns to agents and vendors.
Depth penetration continues to grow, driven by increased Premiere penetration, with REA noting that this was driven by higher uptake rather than geographical mix. It is estimated that depth penetration contributed +6% of the +22% overall residential listing growth in 1H22. REA continues to target moderating growth in overall penetration and increased Premiere penetration.
In the context of a more challenging outlook from lower listings resulting from falling house prices in a rising interest rate environment (likely to impact in FY23), one potential concern is that depth penetration could decline. It is worth noting that over the past two periods of national house price declines (FY12 and FY19), REA did increase depth penetration and as such, the Company is likely to adopt a similar strategy in the future, albeit at a slower rate given already-high levels of depth penetration.
Although, the key question is whether the level of depth penetration adopted by the Company in a falling house price environment is enough to offset the decline in listings. The depth uptake is expected to slow in FY23. Further, the contribution from price increases expected to moderate slightly from the 8% average contracted price rise at the start of FY22. Accordingly, there is a greater reliance on new products, such as REA Connect, a return to growth in ‘Rent’ and ongoing growth in Audience Maximiser (which accounted for ~5% of Australian Residential revenue in 1H22) to support FY23 growth.
Balance Sheet Remains in Strong Position
Despite an increase in gearing (on a net debt to EBITDA basis) from 0.6x in FY21 to 0.8x as at 31 December 2021, REA’s balance sheet remains robust and long-term funding capacity in place. The Group entered into a new $600m syndicated debt facility in September 2021. The facility has two tranches of $400m and $200m. These mature in September 2024 and September 2025, respectively.
The low level of gearing is supported by typically high levels of cash conversion (86% of EBITDA in 1H22) and strong growth in free cashflow.
Fundamental View
We expect share price volatility to continue in the near term, as the market grapples with the extent to which a decline in listings (which are inherently difficult to predict) and higher cost growth mitigate the degree of operating leverage in the business. On balance, this points to downside risk to the rate of earnings growth over the medium term.
Accordingly, with the shares continuing to trade on a premium multiple (the current 1-year forward P/E multiple is ~38x) against a declining EPS growth profile (from +29% in FY22 to ~16% annual EPS growth in FY23 and FY24), we struggle to see any positive catalysts for the shares in the near term.
Charting View
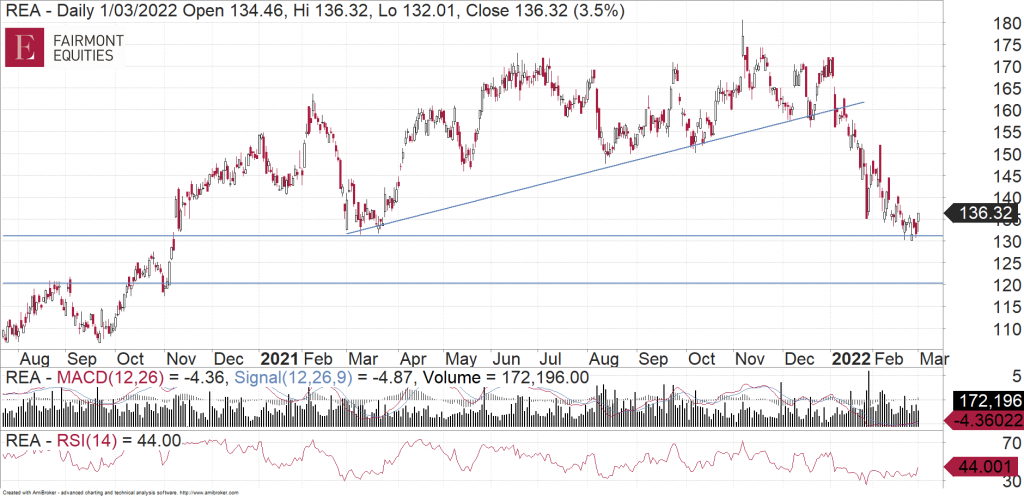
For much of the past year, REA had been respecting an uptrend line. It broke under that at the start of January on increased volume. Trading since then has been poor and risk therefore remains to the downside for now. There is some minor support near $130. If that cannot hold, then the next major level down is just under $120.

Michael Gable is managing director of Fairmont Equities.
Current share prices available here.
You can learn more about technical analysis in this article.
An 8-week FREE TRIAL to The Dynamic Investor can be found HERE.
Would you like us to call you when we have a great idea? Check out our services.
Disclaimer: The information in this article is general advice only. Read our full disclaimer HERE.
Like this article? Share it now on Facebook and Twitter!

