

We bought the banks a few weeks ago and believe that they can head higher. But that view doesn’t extend to Suncorp (SUN). It is currently trading near $15, and the rally in June has almost been explosive. However that could be as good as it gets. Based on the way it is trading here, there is potential downside of over 30 per cent. This means that we could be seeing a great shorting opportunity open up here.
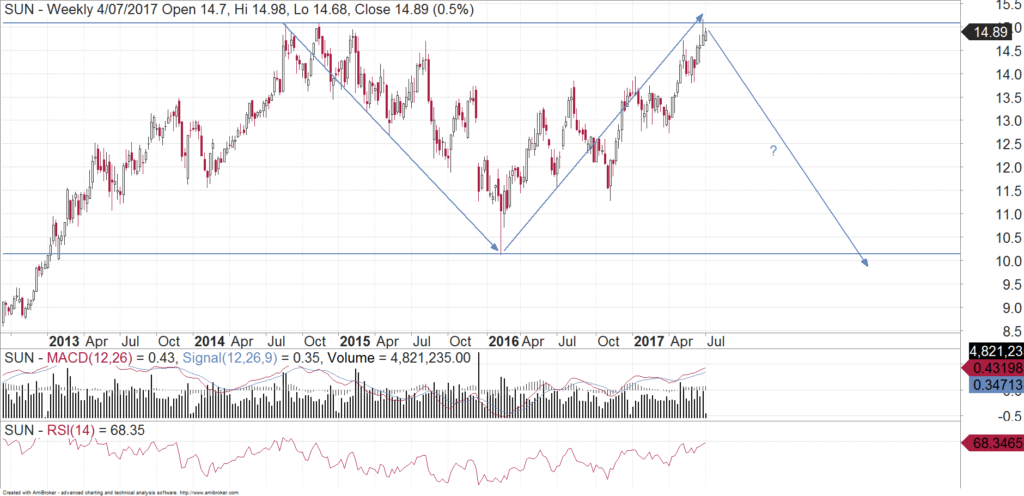
Looking at the weekly chart below, we can see that Suncorp has gone to a marginally new high (compared to its peak in 2014), but it has since failed in the last few days. When we see this on a chart, it usually means that the stock goes back to dip under the previous low. In this case it was made in February 2016. That is a big call to make, but we have seen this play out before. A recent example was with Healthscope (HSO) where we did well to wait for it to make a new low under $2. HSO did the same thing where it failed just above a previous high, and then went back to dip under a previous low.
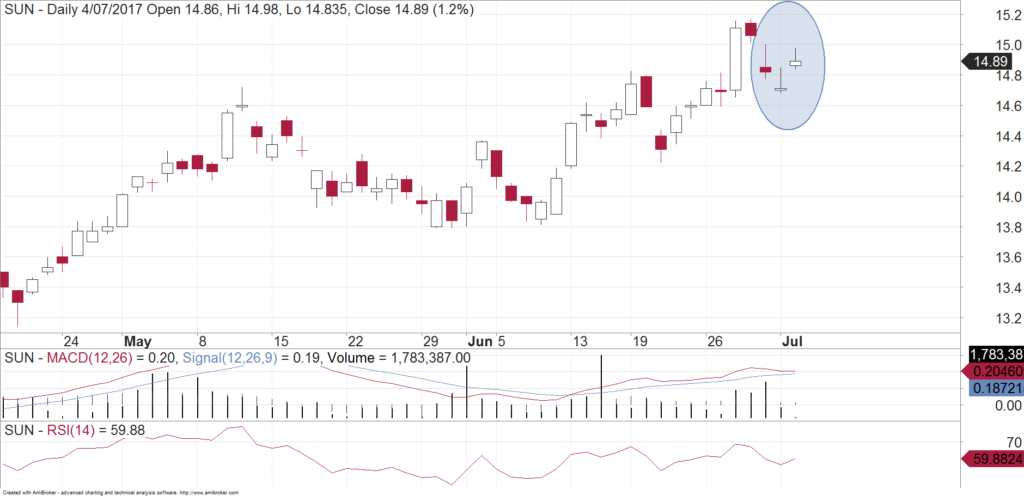
If you look at the daily candlestick chart below, you can see the weakness starting to set it. The long straight lines on each candle represents price rejection from those higher levels.
If Suncorp can get back above $15 in the next few weeks, then the stock is likely to go higher. This means we will have to change our view and close our shorts at a small loss. However, if it can’t get up to that level in the short term, then it is at risk of trending much lower.
Michael Gable is managing director of Fairmont Equities.
Make sure you bookmark our main blog page and come back regularly to check out the other articles and videos. You can also sign up for 8 weeks of our client research for free! Otherwise you can email Michael Gable directly at michael@fairmontequities.com
Disclaimer: The information in this article is general advice only. Read our full disclaimer HERE.