
[vc_row][vc_column][vc_column_text]
At Fairmont Equities we use a rigorous, 5 step analysis based approach to help you grow your portfolio.
This approach combining Fundamental and Technical Analysis has been responsible for producing returns up to 13% when the ASX 200 Index produced a minus 3% return. View our Case Studies.
Our approach is outlined below in the left hand column. The right hand column provides a real case study example illustrating the process.[/vc_column_text][vc_row_inner css=”.vc_custom_1485749836061{border-top-width: 1px !important;border-right-width: 1px !important;border-bottom-width: 1px !important;border-left-width: 1px !important;background-color: #f3f3f3 !important;border-left-color: #cccccc !important;border-left-style: solid !important;border-right-color: #cccccc !important;border-right-style: solid !important;border-top-color: #cccccc !important;border-top-style: solid !important;border-bottom-color: #cccccc !important;border-bottom-style: solid !important;}”][vc_column_inner width=”1/2″ css=”.vc_custom_1485217629363{border-right-width: 1px !important;border-right-color: #cccccc !important;border-right-style: solid !important;}”][vc_column_text]
Stock Selection Process
1) Idea Generation
The initial idea may come about from one or more of the following:
- Results released from a company. A company may show earnings to be greater than expected and provide guidance for the year ahead.
- An event-based ASX announcement. This could include an acquisition or divestment which the market considers very positive to the company.
- Share price weakness. Stocks can often be caught up in general market weakness and this can be an opportunity to purchase a good company at cheaper levels.
We will also look at companies best leveraged to future macro/industry themes and trends.
For example, if we have a view that bond yields are trending in a certain direction, then we can target companies that benefit from that.
[/vc_column_text][/vc_column_inner][vc_column_inner width=”1/2″][vc_column_text]
Case Study Example
This case study follows Orora (ORA) starting in 2015 trading at $2.36.
Once it dipped to about $2.17 In December 2015, we advised clients to buy it. When it hit $2.75 in May 2016, we took a 26% profit excluding dividends.
ORA had their AGM in mid-October 2015. They reiterated their FY16 earning’s guidance and commented that 1Q16 was tracking ahead of the previous quarter.
By affirming full year guidance, we took this as a positive sign.
With economic conditions in general looking to be flat, we decided that this positive earnings guidance was an opportunity worth investigating.[/vc_column_text][/vc_column_inner][/vc_row_inner][vc_row_inner css=”.vc_custom_1485220078582{border-top-width: 1px !important;border-right-width: 1px !important;border-bottom-width: 1px !important;border-left-width: 1px !important;border-left-color: #cccccc !important;border-left-style: solid !important;border-right-color: #cccccc !important;border-right-style: solid !important;border-top-color: #cccccc !important;border-top-style: solid !important;border-bottom-color: #cccccc !important;border-bottom-style: solid !important;}”][vc_column_inner width=”1/2″][vc_column_text]2) Assessment of a Stock’s Fundamentals
We then analyse the following about the company:
- The trend (ideally 4-5 years) in key earnings indicators which include Earnings Per Share (EPS) EPS growth, margins, riskiness of earning, as well as underlying sales growth
- Management/Board stability and track record
- Balance sheet and cash flow trends.
Is the balance sheet strong and is cash flow heading in the right direction? - Trading multiples compared to peer companies and Consensus earnings growth estimates.A company trades at a lower multiple than its peers could represent an opportunity.
- Factors specific to the Company that the market are overlooking or overreacting to.For example, a company might have the potential to make some acquisitions but the market is discounting this.
[/vc_column_text][/vc_column_inner][vc_column_inner width=”1/2″ css=”.vc_custom_1485218491562{border-left-width: 1px !important;border-left-color: #cccccc !important;border-left-style: solid !important;}”][vc_column_text]
Case Study (Continued)
ORA was spun out of Amcor in 2013 and has seen improving profitability and revenue.
They are a market leader in Australasia, the management are experienced and they have helped the company achieve cost savings over time as well as reduce company debt.
The company has been establishing track record in making bolt-on acquisitions that add to earnings.
The trading multiple is in line with historical averages but was not cheap at current levels. This implies an opportunity will be seen on any pullback from current levels.
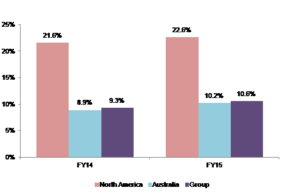
Return on Average Funds Deployed (showing the increase from one year to the next)
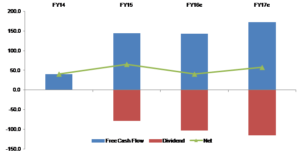
Net cashflow ($m) going up over time
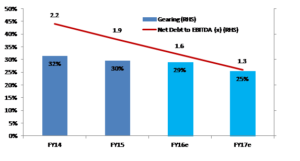
Net debt and gearing heading down over time.
[/vc_column_text][/vc_column_inner][/vc_row_inner][vc_row_inner css=”.vc_custom_1485749852039{border-top-width: 1px !important;border-right-width: 1px !important;border-bottom-width: 1px !important;border-left-width: 1px !important;background-color: #f3f3f3 !important;border-left-color: #cccccc !important;border-left-style: solid !important;border-right-color: #cccccc !important;border-right-style: solid !important;border-top-color: #cccccc !important;border-top-style: solid !important;border-bottom-color: #cccccc !important;border-bottom-style: solid !important;}”][vc_column_inner width=”1/2″ css=”.vc_custom_1485218810301{border-right-width: 1px !important;border-right-color: #cccccc !important;border-right-style: solid !important;}”][vc_column_text]3) Other Fundamental Considerations
Once we have analysed the company’s fundamentals, we then do the following:
- Go through all available broker reports and check if we have missed anything.Because we are not tied to a larger corporation, we have no restrictions placed on us.So we will look at what the other analysts in the market are saying and we are happy to take on any of their ideas and complement them with our own.
- Consider potential positive/negative share price catalysts.There may be risks/opportunities that could impact on the share price.A negative catalyst could include issues with a recent merger undertaken by the company.A positive catalyst could include a company with a strong balance sheet having the potential to make an acquisition.
[/vc_column_text][/vc_column_inner][vc_column_inner width=”1/2″][vc_column_text]
Case Study (Continued)
With ORA, we could see that there was a potential catalyst in the company making further acquisitions in North America.[/vc_column_text][/vc_column_inner][/vc_row_inner][vc_row_inner css=”.vc_custom_1485218821614{border-top-width: 1px !important;border-right-width: 1px !important;border-bottom-width: 1px !important;border-left-width: 1px !important;border-left-color: #cccccc !important;border-left-style: solid !important;border-right-color: #cccccc !important;border-right-style: solid !important;border-top-color: #cccccc !important;border-top-style: solid !important;border-bottom-color: #cccccc !important;border-bottom-style: solid !important;}”][vc_column_inner width=”1/2″ css=”.vc_custom_1485218810301{border-right-width: 1px !important;border-right-color: #cccccc !important;border-right-style: solid !important;}”][vc_column_text]4) Conduct Technical Analysis on a Stock
If the company is fundamentally sound, we then have a look at the chart and consider factor such as:
- Is the stock in a primary up trend?If the stock is already trending higher, then it has a good chance of continuing that trend.
- Is it sitting near any support or resistance levels?If a stock is near support then it may head higher again. Being near resistance means the stock may experience some short term weakness.
- Volume on the way up and down.Volume adds weight to a share price movement. That is, high volume on the way up is more convincing than a move that happens on low volume.
- Whether movements are impulsive or corrective in the direction of the trade.A sharp move is a sign of strength, whereas a very slow movement is less convincing.
- Any warning signs on the candlestick chart or momentum indicators.Price action might show a slowing down in the trend, and momentum indicators can further confirm these warning signs.
- Potential upside and downside levels to determine a risk/reward. Nearby support and resistance levels can give us clues as to where a stock might be able to head to.
[/vc_column_text][/vc_column_inner][vc_column_inner width=”1/2″][vc_column_text]
Case Study (Continued)
ORA was still trending higher in the long term.
It was getting close to some resistance and had the potential to dip lower in the short term.
We could see some support between $2.10 and $2.20 and decided it that we would have a better risk/reward if we could catch it back in those levels.
That would also equate to a cheaper P/E on the fundamental side.
When it hit those levels in December, we had a buying opportunity.
 [/vc_column_text][/vc_column_inner][/vc_row_inner][vc_row_inner css=”.vc_custom_1485749867527{border-top-width: 1px !important;border-right-width: 1px !important;border-bottom-width: 1px !important;border-left-width: 1px !important;background-color: #f3f3f3 !important;border-left-color: #cccccc !important;border-left-style: solid !important;border-right-color: #cccccc !important;border-right-style: solid !important;border-top-color: #cccccc !important;border-top-style: solid !important;border-bottom-color: #cccccc !important;border-bottom-style: solid !important;}”][vc_column_inner width=”1/2″ css=”.vc_custom_1485218810301{border-right-width: 1px !important;border-right-color: #cccccc !important;border-right-style: solid !important;}”][vc_column_text]5) Consider suitability to invest
Once we have identified an opportunity, we then look at each client’s profile to determine whether that would suit them or not.
We consider factors including but not limited to:
- Risk profile.Higher risk individuals may be more willing to trade stocks that perhaps don’t meet all the criteria above compared to lower risk individuals.
- Reliance on income.
If the stock selected has a low yield, then this will not suit an individual that is heavily reliant on dividends to meet living expenses. - The current sectors/stocks that are already in the portfolio.We will take into consideration what is already in the portfolio. A client that is overweight banks for example doesn’t need to be adding another bank to the their portfolio.
- Their investment interests.For example, some clients do not like to invest in gambling stocks. Others are particularly keen on being overweight a sector such as agriculture, so we will take that into account.
After all of the above is achieved, we are ready to inform you of an investment opportunity.[/vc_column_text][/vc_column_inner][vc_column_inner width=”1/2″][vc_column_text]
Case Study (Continued)
Once we decided ORA was a buying opportunity, we determined the following:
- The fact that it was in an uptrend, near support, and had defensive earnings meant that it was suitable for individuals with a low risk tolerance and above.
- A 3.9% yield plus 30% franking meant that it could be suitable for individuals looking for some income as well as growth.
- If a client was not overweight this sector and they fulfilled the above criteria, we informed them of our recommendation to buy ORA.
[/vc_column_text][/vc_column_inner][/vc_row_inner][/vc_column][/vc_row]