Price action for Rio Tinto (ASX:RIO) continues to look positive and the stock appears poised to retest the $90 level. This represents a return of nearly 24% from current levels. Iron ore prices have improved recently and the lower Australian dollar is set to benefit the earnings of Australia’s big miners.
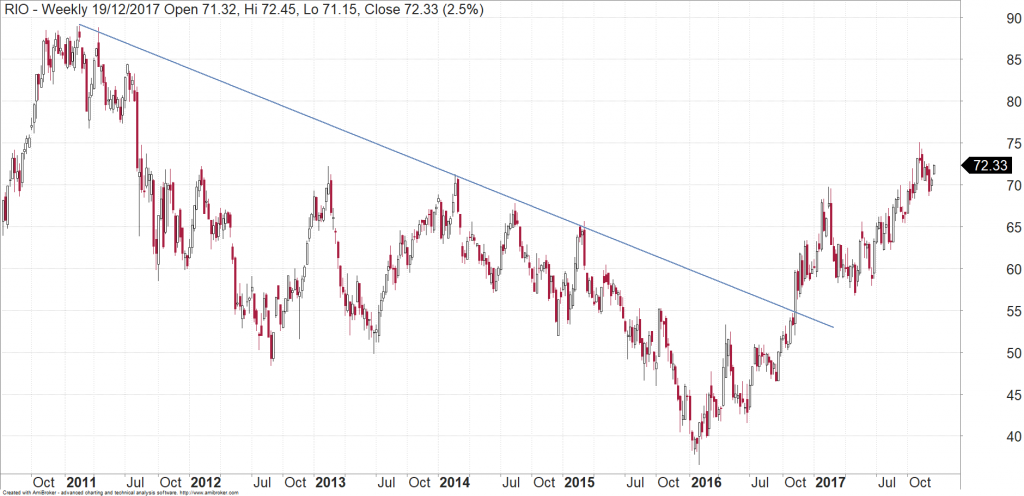
RIO – longer term chart
The first point to note is the breaking of a 5-year downtrend that started in 2011. From nearly $90 at the start of 2011, the shares fell away and ultimately reached a low of under $40 in early 2016. Like most commodity stocks, they managed to stage a recovery. In late 2016, we can see that the stock broke that downtrend. Since then it the shares have trended higher.

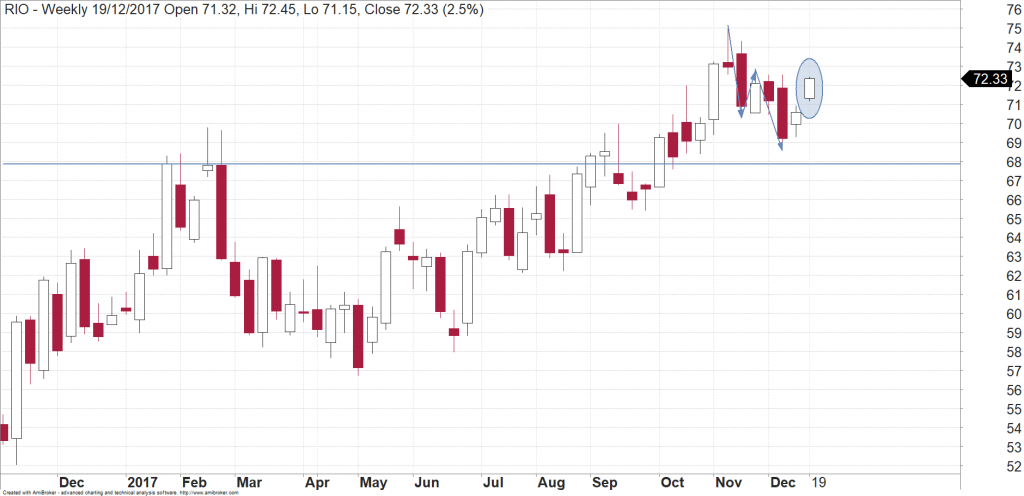
RIO – 12-month chart
The next point to note is the price action from the last several weeks. The $70 level was a major resistance level and for a while there it looked like it wasn’t going to make it through. In early November 2017, it finally pushed higher. What we have seen since that breakout is a small “3 wave” correction to sit on top of the high from early 2017. So the stock has “tested” the previous high and is now bouncing off that (circled).

This bodes well for the direction of RIO. The charts therefore suggest that RIO can keep pushing higher here, with an eventual retest of that $90 level being a possibility for 2018.
Current share prices available here.
You can learn more about technical analysis in this article.
Michael Gable is managing director of Fairmont Equities.
Sign up to our newsletter. It comes out every week and its free!
Disclaimer: The information in this article is general advice only. Read our full disclaimer HERE.
Like this article? Share it now on Facebook and Twitter!

