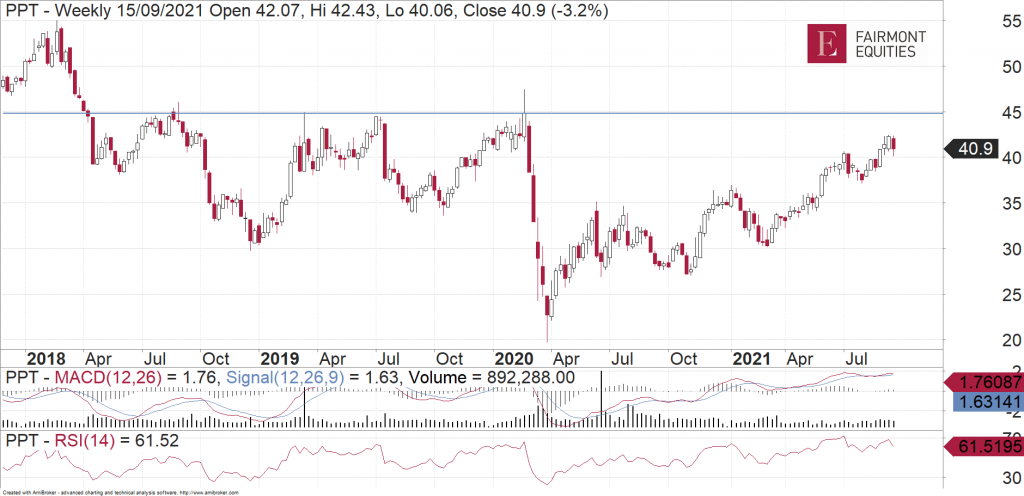
Shares in Perpetual (ASX:PPT) have re-rated over the past six months following a large-scale expansion internationally, fund outflows in the domestic business reversing to inflows, and a greater contribution to profit from performance fees. The Company is in the middle of a transition from an Australian business focused largely on domestic funds management to a more diversified, global fund manager.
At present, the establishment of distribution capabilities in key geographies is still in the early stages and is tracking ahead of plan. While this strategy has the potential to be a real game changer for PPT (and lead to a further re-rating in the shares), the key issues for investors are:
i) Can the Company execute the strategy successfully, and
ii) What is the impact on the shorter-term profitability given that the benefits are likely to be evident over the longer term?
About Perpetual
Perpetual is an independent and diversified financial services group providing specialised investment management, wealth advice and corporate fiduciary services to individuals, families, financial advisers and institutions. The Company has four operating divisions:
1. Perpetual Asset Management Australia (PAMA) is the investment management arm, covering multi-asset classes within Australia.
2. Perpetual Asset Management International (PAMI) has recently been established as a new division by PPT following the Company’s acquisition of Trillium (completed 30 June 2020) and Barrow Hanley (completed 17 November 2020). The establishment of the PAMI division has propelled total Assets Under Management (AUM) to $98.3b (+246% vs FY20), with PAMI accounting for approximately 75% of the total AUM.
3. Perpetual Private includes comprehensive advisory services, portfolio management and philanthropic services to High Net Worth individuals, charities and other not-for-profits.
4. Perpetual Corporate Trust provides fiduciary services, custodial and trustee services for securitisation, unit trusts and debt securities.
Key Fundamental Drivers
What Impact on the Cost Base from Building a Global Distribution Platform?
While a large portion of the increase in cost guidance for FY22 relates to acquisitions (in particular, for Barrow Hanley and Trillium), there is also a sizeable investment into building a global asset management platform.
Over the long term, the increase in cost guidance for FY22 may become immaterial in the context of Perpetual’s future earnings prospects should the Company successfully execute on its investment in distribution and recent expansion in asset management. It is estimated that every 1.0% expense growth equates to >2% NPAT growth.
PPT’s strategy to investing in its distribution capability at the present time is underpinned by Barrow Hanley’s strong fund performance and Trillium’s exposure to the high-growth & in-favour ESG category, which is already attracting flows in Australia and offshore. While this investment will impact the near-term profitability, it should attract fund flows in the medium term.
Further, the required increase in FUM to at least cover the increased cost of offshore distribution capability would not be significant. More specifically, it is estimated that ~$4b of FUM (in context, group FUM is $98.3b) earning a base fee of ~50 basis points will cover the potential step-up in the cost base (i.e. $20m) for the offshore distribution initiatives.
Addressing the Long-Term Trend in Outflows – PAMA
Net flows remain a key focus for investors given the historical outflows of PPT’s asset management business, the recent acquisitions of offshore asset management operations and the significant investment in distribution capabilities. Most of Perpetual’s equity strategies are value-oriented and only over the past 12 months has there been some market rotation to value strategies after +10 years of growth outperformance.
While performance is strong in almost all of PPT’s funds, net outflows continued to be mostly driven out of the institutional channels within the recently-established PAMI division. PAMI’s net outflows were driven by US equities and fixed income products. PPT noted $0.2b of inflows into Trillium (US flows only), suggesting outflows were overwhelmingly driven by Barrow Hanley. However, it is worth noting that PAMI has secured US$1.3b in recent mandate wins. Half of these are already funded at the start of FY22, and the other half will be funded in the rest of FY22.
Overall, on a 1-year basis, all of PPT’s strategies and 78% of Barrow Hanley’s strategies outperformed their benchmarks, which in turn is supportive for fund flows, as is the continued rotation into value. Over a 1-year period, the Industrial Share Fund and Australian Share Fund are outperforming the benchmark by ~360 basis points and ~930 basis points. However, most of PPT’s flagship funds remain below benchmark over horizons greater than one year as at July 2021, including its two largest strategies, the Industrial Share Fund and Australian Share Fund.
Strong Balance Sheet Position Provides Scope for Further Acquisitions
PPT’s balance sheet is robust and well positioned to support future growth with a low debt to capital ratio of just 16% and interest cover of 21x. Importantly, the balance sheet headroom provides scope for PPT to pursue further acquisitions, with the Company still considering acquisitions in asset management, including in Australia, with an interest in alternatives and private markets. This should help to balance out its relatively high exposure to US equities (<50% of Assets Under Management).
Fundamental View
The strategy to build distribution is not without risk; namely that revenue does not follow, outflows continue and/or markets become less favourable. We would prefer to see fund flows into Barrow Hanley before we consider the strategy to increase investment in distribution to be successful, especially given that outflows in Barrow Hanley continue.
Other key factors precluding a more favourable view on PPT include:
i) The potential for further upward revisions in the cost guidance. This would impact earnings growth and sentiment over the short term, given that any benefits from increased cost investment are medium-term, and
ii) The lack of momentum in fund flows in both PAMA and Barrow Hanley.
Charting View
PPT has been trending very well since the lows in 2020. The trend still looks strong and sustainable and for now it should continue to edge higher. However, on our weekly chart, we can see that there is major resistance looming near $45. That could possibly be a region where profits can be taken before the stock starts to consolidate again.

Michael Gable is managing director of Fairmont Equities.
Current share prices available here.
You can learn more about technical analysis in this article.
An 8-week FREE TRIAL to The Dynamic Investor can be found HERE.
Would you like us to call you when we have a great idea? Check out our services.
Disclaimer: The information in this article is general advice only. Read our full disclaimer HERE.
Like this article? Share it now on Facebook and Twitter!

