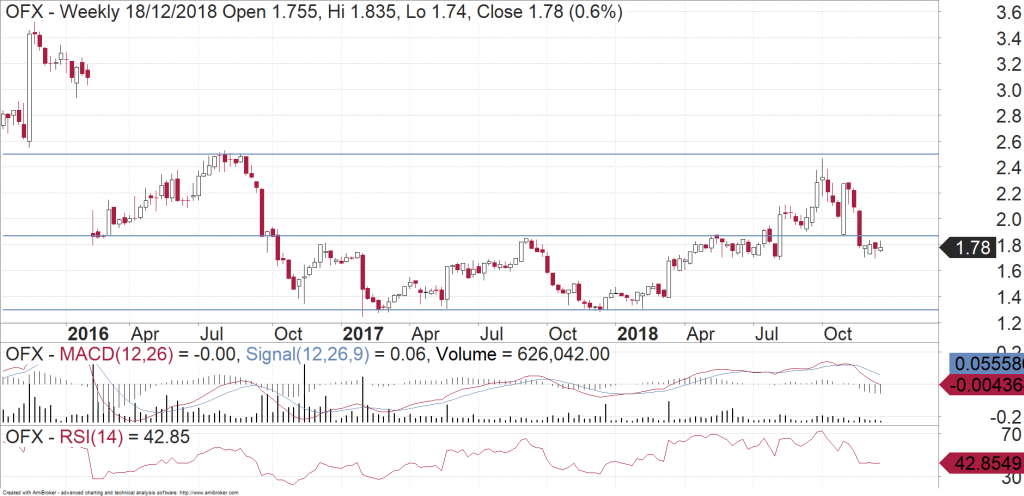
The OFX Group (ASX:OFX) share price is down nearly 50 per cent in the last 3 years. Can a number of recent initiatives turn the business around and therefore make it an attractive investment down at these levels?
About OFX Group
OFX Group is a provider of international payment services and international payment solutions. They operate across four geographical regions: Australia & NZ, Europe, North America and Asia. International payment services are monitored by geographic region (based on client location) and provide bank to bank currency transfers servicing businesses and consumers. International payment solutions are monitored globally. They provide strategic partners with a package which includes: OFX technology platform; client service; compliance sophistication; banking relationships; and payments capabilities.
The key operating metrics (i.e. lead revenue indicators) for OFX are the number of active clients, the number of transactions and turnover.
There are also key macro drivers for the revenue base. OFX’s portfolio is heavily skewed to the A$. Both the level of volatility in the A$ and the performance of the A$ against other major currencies are key drivers of activity and revenue. During 1H19, the depreciation of the A$ against major currencies such as the US$ and € in particular supported revenue momentum. This is despite a lower level of volatility in the A$ (against the US$).
Key Observations From Recent Performance
Decline in Active Client Numbers
Whilst the above factors contributed to an improvement in the key operating metrics for the six months to 30 September 2018 (1H19), the number of active clients (i.e. those who have transacted over a 12-month period) declined in 1H19. The decline in the number of active clients in 1H19 was due to a fall in active consumer clients in the UK. This was because of a shift in marketing from the UK to North America. While there was growth in active clients in North America, Asia and in the corporate segment, it was not enough to offset the lower active client growth in the UK and Australia. Further, the 1H19 decline has come after an improvement over the last two half-year periods. This was driven by a rebranding strategy that resulted in the conversion of a higher number of potential clients into active clients.
Operating Leverage Still Not Evident
Notwithstanding lower active client growth, revenue growth (Net Operating Income) rose by 11.9% as a result of:
• a higher level of transactions per active client,
• a higher level of average transaction values,
• higher turnover, and
• a growing corporate customer base.
Despite the weakness in total end active clients, there is likely to be continued strong growth in turnover, highlighting the benefits of attracting corporate customers.
However, as has been evident in the recent past, the Company’s investment in growth initiatives (in particular upfront investment in headcount and promotional expenses as the Company expands offshore) led to a 12.8% increase in operating costs. Accordingly, the EBITDA margin declined noticeably in 1H19, to 24.2% (from 29.3% in 2H18 and 25.0% in 1H18) and has yet to recover to the levels seen in FY15 (33.3%) and FY16 (30.8%).
Fundamental View
That operating leverage is not evident at a time when the A$ has depreciated against major currencies is of concern. While the outlook for the A$ remains weak, we would prefer to see a turnaround in margin before taking a more favourable view on OFX. In particular:
i. The decline in active clients reflects high level of competition in this sector and tough macro conditions (i.e. low currency volatility), notwithstanding that the strategy to increase the portion of corporate customers reduces the business’ exposure to macro weakness.
ii. Under new management, OFX’s strategy to focus on winning corporate customers has come at a cost to margin. While revenue growth in recent periods was largely driven by corporate clients, the latter typically attracts a lower margin mix.
Finally, the shares are trading on a 1-year forward P/E multiple of ~20x, which does not appear to offer value given that consensus EPS growth forecasts for FY19 are 10% and declining to mid-single-digit in FY20.
Charting View
OFX has been trading sideways between about $1.30 and $1.85 during the last two years. It finally broke free of that range in August, rushing up towards resistance near $2.50. However, the shares have since fallen back to the bottom of the new range. At the moment it has fallen under the floor near $1.85. For now, it is struggling at current levels. This means that OFX could fall back towards the prior lows near $1.30.

Current share prices available here.
You can learn more about technical analysis in this article.
An 8-week FREE TRIAL to The Dynamic Investor can be found HERE.
Michael Gable is managing director of Fairmont Equities.
Sign up to our newsletter. It comes out every week and its free!
Would you like us to call you when we have a great idea? Check out our services.
Disclaimer: The information in this article is general advice only. Read our full disclaimer HERE.
Like this article? Share it now on Facebook and Twitter!

