CIMIC Group (CIM) endured a challenging 2019. It was underlined by disappointing financial results, challenges in the Hong Kong construction business, concerns about cashflow performance and a substantial write-down of its Middle East business. Has the resultant share price fall provided us with a great chance to pick up CIM at cheap levels? Or is buying it here a value trap?
About CIMIC Group
CIMIC is an engineering-led construction, mining, services and public private partnerships Company. It works across the lifecycle of assets, infrastructure, and resources projects. Operations include construction business CPB Contractors, including Leighton Asia and Broad, mining and mineral processing companies Thiess and Sedgman, services specialist UGL and CIM’s public private partnerships arm Pacific Partnerships. The Company has three reporting divisions: Construction, Mining & Mineral Processing (‘Mining’) and Services.

Mining Division is the Main Source of Earnings Growth
While the Mining division only accounts for around 30% of group revenue, it is the main contributor to earnings, accounting for 49% of EBIT in FY19. int their recent results, the Mining division once again exceeded expectations. The better-than-expected earnings performance was underpinned by a number of contract extensions, increased production levels and leveraging efficiencies (including higher utilisation). This led to an expansion in the EBIT margin from 11.3% in 2H18 to 15.1% in 2H19. EBIT margin growth is expected to continue to be driven by additional contract extensions.
Challenges Remain for the Construction Division
While the revenue outlook for the Construction division is supported by a strong pipeline of infrastructure work in Australia out to 2023, divisional earnings have been impacted by a decline in activity for the Company’s Hong Kong business, as well as a change in market conditions with a shift to more alliance-style projects. We discuss these two issues in further detail below.
Earnings for the Construction division are also becoming increasingly harder to predict with any certainty. This is in light of the increasing challenges faced by operators in securing payment for work completed and recovering costs incurred in securing work.
Conditions in Hong Kong Slowly Improving
The Hong Kong Construction business, which is a minor contributor to CIM’s group WIH, has been impacted by an investigation into allegations involving Leighton Asia’s work at Hung Hom station in Hong Kong. This resulted in Leighton Asia being banned from bidding for tenders for one year from October 2018. The investigation has also impacted Leighton Asia’s win rate on future contracts.
Uniquely combining both Fundamental and Technical Analysis
Not yet a subscriber? Join now for FREE!
Receive our weekly tips and strategies into your inbox each week.
BONUS: Sign up now to download our 21 page Trading Guide.
Pleasingly, the Hong Kong business appears to be turning a corner. The Company comments at the results release in February indicated that CIM is able to start bidding on government work again over next few months. Overall, we expect a gradual recovery for the region, noting that Hong Kong’s contribution to group WIH has been in decline.
Impact of Alliance-Style Contracts on Margin
Alliance-style contracts now make up ~25% of the Construction division’s Work in Hand (WIH). This means that when considering the lower risk/schedule of rates nature of contract mining and services, around two-thirds of the group’s WIH has a lower risk profile in comparison to a typical construction project. While the strong pipeline of infrastructure work supports revenue growth for the Construction division, it is worth noting that the shift to more alliance-style projects has led to a significant re-basing of EBIT margin. The latter fell to 5.2% in 2H19, compared to the 7.0% – 8.5% range reported by the division over the course of FY16 to FY18.
Further, the shift to a greater proportion of alliance-style construction contracting (which are more working capital intensive in comparison to fixed-price contracts) also impacts the level of operating cash conversion.
Is CIMIC’s Balance Sheet as Strong as it Seems?
The reported net cash position declined from $1.62b as at 31 December 2018 to $832m as at 31 December 2019. This was a result of the Company providing additional funding to BIC Contracting (BICC) as part of CIM’s decision to exit this business.
While CIMIC has historically reported net cash positions since 2015, the use of debtor factoring implies that the balance sheet is actually a net debt position. This is given that debtor-factoring is considered to be “debt-like” working capital financing.
Based on a factoring balance of $1.96b as at 31 December 2019, as well as a supply chain finance balance of $851m and the expected +$1.0b cash outlay required as part of the BICC exit, the adjusted net debt position is ~$3.0b, which, in context, represents relatively modest gearing of ~1.7x.
Fundamental View
Group earnings growth is now increasingly reliant on further growth from the Mining division. This is in light of the challenges in the Construction division and the fact that earnings growth for the Services division is likely to be minimal. This is also due to the fact that the earnings benefit from cost savings generated following the UGL integration has passed.
CIM’s 1-year forward P/E multiple has halved over the last 12 months, from ~18.5x around 12 months ago, to ~9x at present. It is also well below the long-term average of ~16x. Notwithstanding that the shares now appear to be in ‘value’ territory, we consider that the above factors, combined with recent market volatility, as well as the financial impacts arising from the significant write-down from the BICC exit (i.e. reduced cash balance and suspension of the final dividend for FY19) warrants a cautious view on the Company’s fundamentals.
Charting View
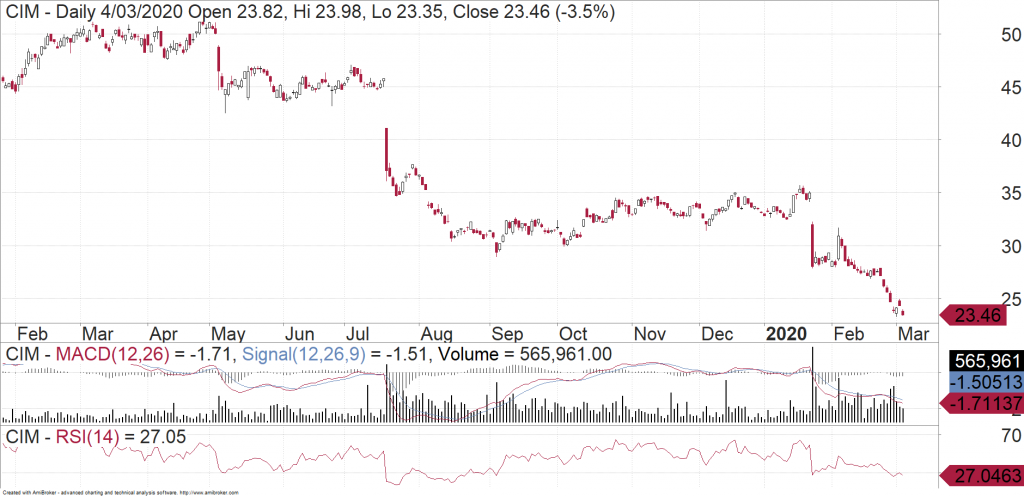
CIM shares have been trending lower for a year now. It started to edge higher at the end of 2019. However, in January it gapped down on strong volume to resume the downtrend again. Since then we have seen the shares drift away with a lot of volume still going through. At this rate it looks as though CIM will continue to edge lower. There are no signs yet that it is ready to bounce. It would likely need at least several weeks or so to try and build a new base and establish support at lower levels. Based on the chart it is too early to be coming in and buying CIM shares.

Michael Gable is managing director of Fairmont Equities.
Current share prices available here.
You can learn more about technical analysis in this article.
An 8-week FREE TRIAL to The Dynamic Investor can be found HERE.
Would you like us to call you when we have a great idea? Check out our services.
Disclaimer: The information in this article is general advice only. Read our full disclaimer HERE.
Like this article? Share it now on Facebook and Twitter!

