After a lacklustre share price performance over the course of 2019, we recently revisited AusNet Services (ASX:AST) following the release of its interim results for the six months to 30 September 2019 (1H20). While the main attraction of AST has typically been its attractive yield, we consider whether investors may lose out anyway due to share price depreciation.
About AusNet
The Company owns and operate three regulated energy network businesses. These include Victoria’s high voltage electricity transmission network, an electricity distribution network in eastern Victoria, and a gas distribution network in western Victoria. These energy networks are regulated by the Australian Energy Regulator (AER) in 5-year cycles and account for over 90% of group earnings. The remainder of the Company’s earnings is generated by its Mondo energy services business, which provides contracted infrastructure asset services and technology solutions to 3rd parties.
Can growth in distributions be maintained?
Distributions paid by AST over the last two financial years have grown by at least 5% and the Company’s guidance for distributions in FY20 indicate a similar growth path. While the Company expects distribution growth to moderate beyond FY20, there are a number of levers available to maintain distribution growth. These include further cost savings, growth in unregulated revenues (i.e. from the Mondo business), a staggered timeframe for regulatory decisions, headroom in debt/credit rating metrics, as well as strong dividend cashflow coverage.
Targets for contracted business remain despite recent underperformance
The Company aims to growth its regulatory asset base (currently around $9.6b) by 3% per annum to FY22. It also aims to growth its contracted asset base from $0.78b at present to $1.5b by FY24. The growth in the asset base for the latter is underpinned by a strong pipeline in renewable projects.
However, the performance of the Mondo business has been impacted by a number of factors. These include:
- The exit of a number of low margin non-core field service agreement contracts,
- Earnings contribution from recently-completed contracted projects appear to be lower than expected, and
- The timing of completion for new projects has been pushed out to later in FY20 (i.e. 4th quarter).
Despite these factors, the Company has maintained its asset base target for Mondo of $1.5b by FY24, citing a strong pipeline of large-scale projects across solar, wind, pumped hydro and storage.
Fundamental view
AST is offering a cash yield of 5.9%, or 6.9% on a grossed-up basis (assuming 40% franking). While the yield remains attractive, we take a cautious view for a number of reasons:
i. We consider that the growth profile for the contracted asset base is likely to be impacted by a notable slowing in the deployment of renewable generation. As such, there is risk that the $1.5b target may take longer to achieve.
ii. There has been a raft of changes to key leadership positions, and there could be more management changes, as the new MD Tony Narvaez (who commenced on 1 November 2019) is likely to review and refine the current strategy. However, over the medium-term, any changes to management/strategy could result in further cost reductions. This is important from the viewpoint that cost savings generated by AST in the past have generally been effective in mitigating revenue pressure from the regulatory asset base.
iii. The regulatory risk profile has increased, namely from a CAPEX allowance under the Draft Decision for Electricity Distribution being lower than AST’s proposed level. In turn, this may impact the growth profile for the regulated asset base, given that the Electricity Distribution segment accounts for nearly 50% of group revenue.
iv. A key valuation metric for AST is the Enterprise Value to Regulated & Contracted Asset Base ratio, which is 1.38x as at the time of writing and at the upper end of the recent range.
Charting view
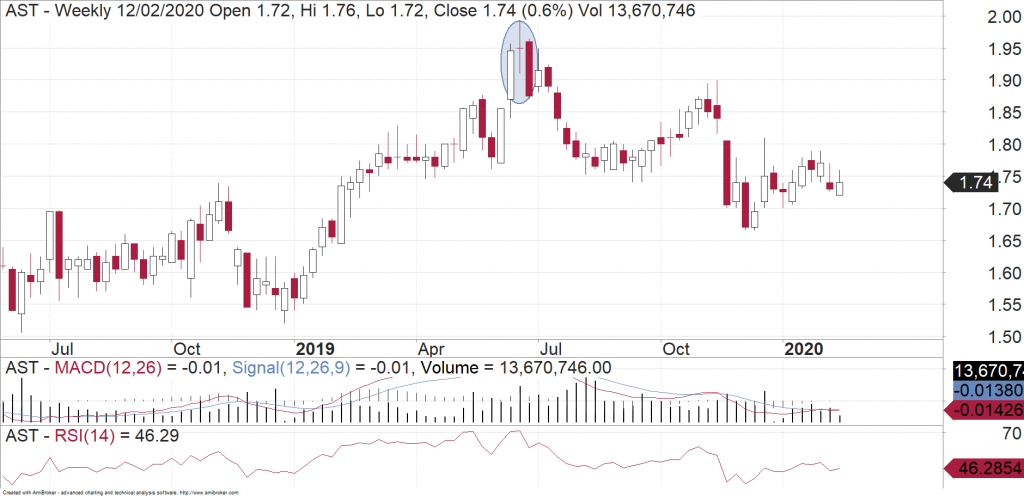
For the time being, it looks as though AST shares will head lower. There was an obvious reversal signal in June (circled). When the shares finally tried to rally back up to that level a few months later, they rejected again and were sold off heavily. Even recently we saw more price rejection of the old support level near $1.80. The low at the end of last year was near $1.55 so at this rate, it looks like AST will continue to slide. Those looking to invest in AST are likely to have a chance to get the shares at cheaper levels, so chasing the yield here could result in you giving it all back in capital depreciation.

Michael Gable is managing director of Fairmont Equities.
Current share prices available here.
You can learn more about technical analysis in this article.
An 8-week FREE TRIAL to The Dynamic Investor can be found HERE.
Would you like us to call you when we have a great idea? Check out our services.
Disclaimer: The information in this article is general advice only. Read our full disclaimer HERE.
Like this article? Share it now on Facebook and Twitter!

