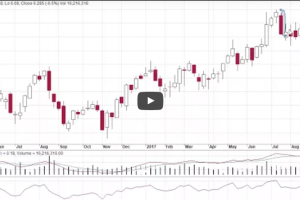
IAG reported today and the share price tumbled. At one stage it was down 10%. In our weekly research that we send to clients, we warned a week earlier that there was something wrong with the IAG chart. The chart was giving us clues that the market did not like the stock. We had recently warned of upcoming weakness in Suncorp and QBE, and those concerns played out. With IAG also getting sold down heavily, how did we identify the warning signs in order to apply that again in the future?
Michael Gable is managing director of Fairmont Equities.
Make sure you bookmark our main blog page and come back regularly to check out the other articles and videos. You can also sign up for 8 weeks of our client research for free! Otherwise you can email Michael Gable directly at michael@fairmontequities.com
Disclaimer: The information in this article is general advice only. Read our full disclaimer HERE.

