We recently revisited CIMIC Group (ASX:CIM) after the Company reported results for the six months to 30 June 2020 (1H20).
COVID-19 restrictions having an impact on the business from a number of perspectives. These include delayed project awards, a slowdown in activities, and cash collection. Despite this, the Company reported an expansion in operating margins. In particular, EBIT margin in the Construction and Services divisions were better than expected.
Can this momentum continue and what are the factors likely to lead to a re-rating in the shares?
About CIMIC Group
CIM is an engineering-led construction, mining, services and public private partnerships company working across the lifecycle of assets, infrastructure and resources projects. Operations include construction business CPB Contractors, including Leighton Asia and Broad, mining and mineral processing companies Thiess and Sedgman, services specialist UGL, and CIM’s public private partnerships arm Pacific Partnerships.
The Company has three reporting divisions: Construction, Mining & Mineral Processing (‘Mining’) and Services, as well as a Corporate segment. This mainly includes contributions from corporate, EIC Activities, Pacific Partnerships and the commercial & residential business, as well as CIMIC’s investment in Ventia.
Key Fundamental Drivers
New Work Continues to be Secured
CIM reported Work In Hand (WIH) of $38b, with the Company adding $4.9b of new work in 1H20. This increase came about despite COVID-19 leading to a temporary delay in the awarding of new projects. This delay impacted the amount of work secured in the June 2020 quarter.
In terms of the outlook for WIH, this is expected to be supported by the reinstatement of licenses in Hong Kong after a ban imposed in October 2018 was lifted. The lifting of the ban now enables the Company to bid on government work.
Supportive Macro Environment Underpins Project Pipeline
The macro background remains solid in CIM’s core markets across transport, infrastructure, and resources, with a strong tendering pipeline. Most of CIM’s construction work is government-related. It forms part of critical infrastructure. Along with mining, construction is considered an essential service.
The Company’s pipeline of opportunities has grown 17% (on a year-on-year basis), with around $70b of relevant tenders expected to be bid and/or awarded for the remainder of FY20, and a further pipeline of $470b in FY21 and beyond.
Balance Sheet is Well Managed
In response to an increased net debt position and cashflow weakness in 1H20, CIM increased overall liquidity as “a precautionary risk mitigation measure in light of potential COVID-19 financial market uncertainties”. Overall, refinancing risk is low and cashflow is expected to improve in 2H20, in line with seasonal trends.
A potential sale of 50% of the Company’s Mining business (Thiess) is likely to strengthen the balance sheet further, by either using sale proceeds to reduce debt or implement capital management initiatives. Market valuations for Thiess currently range from $4.0-4.6b. Assuming a 50% sale at the lower end of this range would imply sale proceeds of ~$2.0b. If we then assume that half of this is used to reduce the current net debt balance of $1.3b, then net debt levels would be significantly lowered to ~$300m. This would leave $1b for capital management.
Fundamental View
We are attracted to CIM’s fundamentals on the basis that:
- The project pipeline remains solid and is supported by a favourable macro environment. Accordingly, the Company has neither updated nor withdrawn guidance since the COVID-19 pandemic, but noted a positive outlook for its core markets (i.e. infrastructure construction and mining).
- Aside from the positive implications for the balance sheet from a sale of 50% of Thiess, there is likely to be valuation support for CIM shares. This is because the Construction, Services and Corporate businesses command a higher earnings multiple (~10-12x) in comparison to the Mining division (~7-8x).
At present, the shares are approaching ‘value’ territory. They are now trading on a 1-year forward P/E multiple of ~10x. This multiple is at a significant discount to the CIM’s ASX-listed contractor peers and well below CIM’s long-term average of ~15-16x.
Charting View
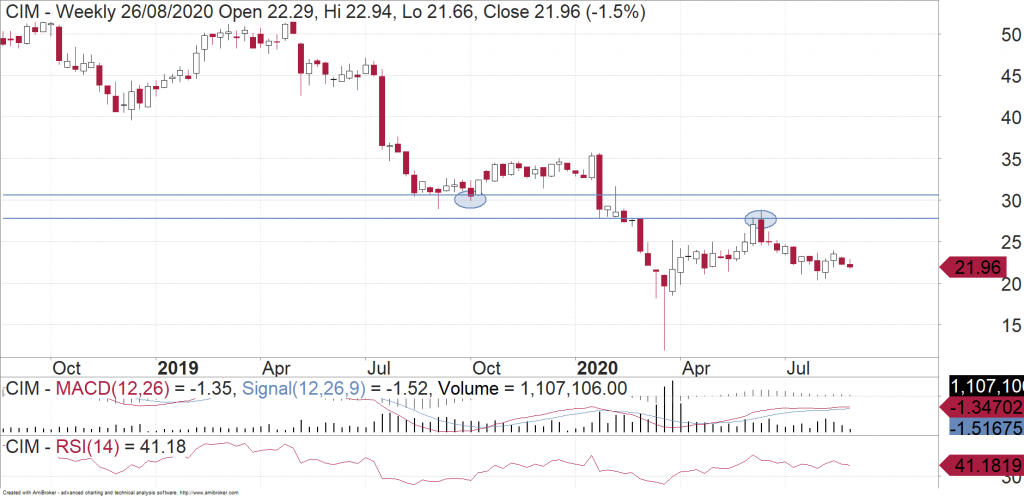
CIM bounced well off the lows in March, but on a weekly chart we can see that the share price was trending lower during the 12 months before that. When the stock peaked in June, it was sold off heavily. It also failed to overlap the low from last year (circled, horizontal lines) and left a gap. A high and low which fail to overlap in this manner is a sign of a strong trend, in this case, a downtrend. We therefore need to see more signs that the CIM share price has stabilised before we can get positive on the chart as well. If it can push above $24, then that would help its cause and at least indicate that it might try to go for a run towards the high $20’s again. Otherwise nearest support is back near $20.

Michael Gable is managing director of Fairmont Equities.
Current share prices available here.
You can learn more about technical analysis in this article.
An 8-week FREE TRIAL to The Dynamic Investor can be found HERE.
Would you like us to call you when we have a great idea? Check out our services.
Disclaimer: The information in this article is general advice only. Read our full disclaimer HERE.
Like this article? Share it now on Facebook and Twitter!

