REA Group (ASX:REA) recently reported results for the 12 months to 30 June 2021 (FY21). The FY21 results highlighted operating leverage as well as strength in the underlying business. Despite this, the share price has gone backwards. A key reason for the sell-off in the shares following the result release was that the outlook for listings growth was softer than expected. We assess the positive & negative factors influencing the outlook for listings growth in FY22, which is a key catalyst for the shares going forward.
About REA Group
REA Group operates the leading online property classified listing website in Australia (realestate.com.au). The Company also has operations in South East Asia, India and the US. News Corp owns a 61.6% stake. However, the Australian operations are overwhelmingly the main value and profit drivers. Within the Australian operations, over 80% of revenue is generated from the listings & depth advertising. 
Following the acquisition of Mortgage Choice in March 2021, REA currently has a #2 retail mortgage broking leadership position, with a 5% market share. The acquisition of MOC (as well as a 34% interest in Simpology in June 2021) will enhance REA’s ability to gain share in the >$400b per annum home loan market, with the likely launch of a white label product seeing REA also address the 40% of the market not serviced by a broker.
realestate.com.au was recognised as one of Australia’s top 10 online brands, ranking 8th as of June 2021.
Key Fundamental Drivers
Is there Potential for the Recovery in Listings to be Stronger than Expected?
REA’s national residential buy listings rose by 15% for FY21 (Sydney +25%, Melbourne +11%), with growth of 54% in 4Q21 driven by strong activity levels at the end of the year. National buy listings in the month of July 2021 were down 3% vs the prior corresponding period, reflecting lockdowns in Sydney (-22% vs +3% in Melbourne).
There are two factors that have the potential to lead to a quicker recovery in listings: NSW stamp duty reforms and depth penetration.
i. In relation to NSW stamp duty reforms, NSW Treasury contends that the abolishment of stamp duty could increase transaction volumes by around 50%, although this benefit is likely to be gradual. The NSW property market generally accounts for between 26-27% of national listings, and with a median home value ~30% above the national average, is also a much higher yielding state for the classifieds players. However, this positive mix impact is likely to be mitigated by the NSW stamp duty reforms currently being contemplated to exclude the top 20% of properties by value (a way to reduce the near-term revenue impact from any changes).
ii. History suggests a strong rebound in pent-up listings could offset a near-term weaker housing environment. A key aspect of this is increased penetration in depth advertising. REA has three depth products: Premiere, Highlight and Feature. The highest-yielding listing product, Premiere continues to outperform, with a sizeable increase in penetration demonstrating the superior returns to agents and vendors. Penetration growth in FY21 was experienced across all major states with strong performance particularly in 2H21.
The significance here is that following recovery from declining listing volumes, depth penetration typically increases, with a skew towards the higher-yielding products in order to maximise exposure to the recovery in listings.
Over the longer term, listing volumes are expected to normalise, with potential upside from new products such as REA Connect, Stamp duty reforms that drive housing turnover structurally higher, as well as growth options in international markets. As such, movements in listing volumes in any one year should be incidental to the REA’s valuation.
Can Operating Leverage Continue?
Operating leverage at the group level has been evident over the last several years and the Company has demonstrated an ability to flex costs up and down due to variable nature of cost base.
The extent of the operating leverage in FY21 increased, where revenue growth of +11% exceeded growth in underlying operating costs of +3%.
This rate of cost growth was driven largely by a 12% increase in employee benefits, reflecting increased incentives linked to strong financial results, higher headcount and remuneration increase. Technology and other costs also increased, up 9% due to higher revenue-related variable costs. This growth was partially offset by a 20% reduction in marketing related spend.
While the Company expect that operating leverage in FY22 is likely to be more in line with pre-COVID-19 levels, given a likely step-up in costs, we estimate that the latter is likely to lead to operating leverage turning negative in FY22, before returning positive in FY23. Namely, some of the cost reductions (travel, entertainment, marketing) from FY21 will come back in FY22. Also, FY22 will see the impact of a double pay increase (in December 2020 and June 2021) for REA staff, after the Company deferred salary increases due to COVID-19.
Gearing Level Remains Comfortable
The increase in the level of debt as at 30 June 2021 reflects the debt-funded acquisition of Mortgage Choice via drawdown on $520m NAB bridge facility, which matures in July 2022. Notwithstanding the increase in debt, gearing (on a net debt to EBITDA basis) remains comfortable at 0.6x and is supported by strong levels of free cashflow.
Fundamental View
While market expectations for listings volume growth in FY22 have moderated (currently range from -3% to +2% compared to +15% in FY21), the ultimate outcome on listings in FY22 – and the likely recovery into FY23 – remains far from certain, especially considering the current lockdown in Sydney (which is the key market in terms of volume and level of depth).
This factor, coupled with additional cost growth in FY22 impacting profitability, is likely to limit a material re-rating in the shares from current levels.
Charting View
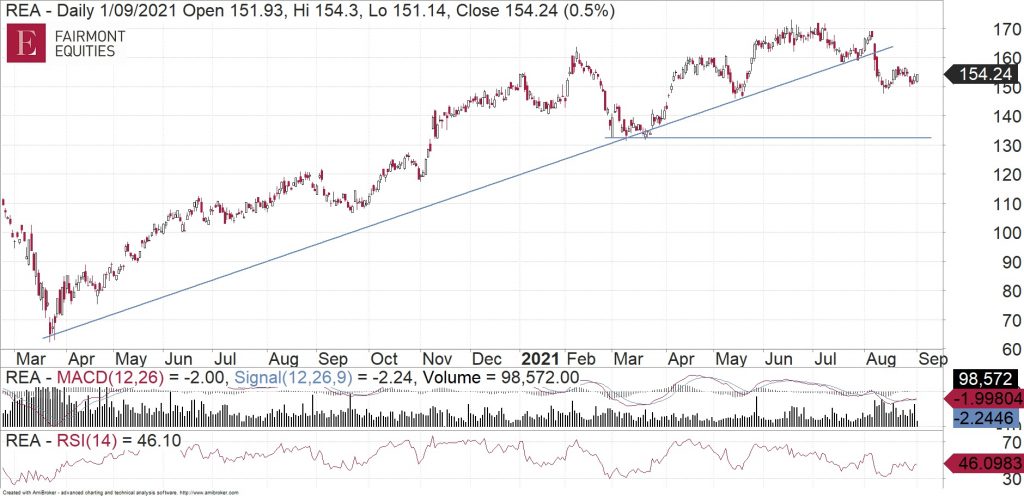
We can see on this chart that REA failed to make much progress during June and July. In early August, it broke under support at $160 on high volume. It has since continued to fall on high volume. This means that we are likely to see lower levels from here in REA. Nearby support is around $130. We would therefore be looking for signs of a reversal off that level lower down before it comes a buying opportunity again.

Michael Gable is managing director of Fairmont Equities.
Current share prices available here.
You can learn more about technical analysis in this article.
An 8-week FREE TRIAL to The Dynamic Investor can be found HERE.
Would you like us to call you when we have a great idea? Check out our services.
Disclaimer: The information in this article is general advice only. Read our full disclaimer HERE.
Like this article? Share it now on Facebook and Twitter!

