We recently revisited Goodman Group (ASX:GMG) after the release of a trading update for the September 2021 quarter (1Q22). In this update, the Company upgraded FY22 EPS guidance to be more than 15% growth, from 10% previously. While upgrades to earnings guidance are the norm for GMG, the latest upgrade is quite a material one and appears to be the first time the Company has upgraded guidance at the 1st quarter.
Accordingly, with the share price having re-rated from the recent low of $20.79 in mid-October, we assess whether there is scope for further upside from current levels.
About Goodman Group
Goodman Group is an integrated property group, with operations throughout Australia, NZ, Asia, Europe, UK, US and Brazil. The Company is one of the largest specialist fund managers of industrial property globally and derives revenue from four sources: Property rent, developments, investments, and funds management.
The Management division is the main driver of group earnings. Earnings from the Management division comprise investment management, including portfolio performance fees and property service fees.
The Development division sources land and uses 3rd party builders to construct high-quality industrial assets and business parks, predominantly for 3rd party logistics providers and large retailers (both online and traditional).
Key Fundamental Drivers
Development Work In Progress Continues to Grow
There has been a significant ramp-up in Development Work in Progress (WIP) since FY19, underpinned by:
• Changing tenant requirements in the aftermath of COVID-19. In particular, i) Increasing space requirements, where there is now an increasing preference to relocate to new builds to satisfy space requirements rather than expanding an existing location, ii) Better utilisation of warehouses space and iii) Increasing trends to be in key locations closer to end customers and a willingness to pay a premium rent to do so.
• A higher portion of multi-storey projects, which typically generate higher $ value per m2, and higher m2 on a land parcel) and which now make up ~60% of development WIP.
For FY21, WIP was $10.6b and the Company at the time of the results release guided to a WIP balance of ~$10b-11b going forward. For 1Q22, GMG reported WIP of $12.7b. The stronger-than-expected growth in WIP in 1Q22 was also driven by $3b of commencements, which is a historic record for the group. Current demand indicators suggest that WIP of ~$12b can be maintained. Importantly, the time to develop has elongated to 22 months (from 19 months as at FY21) providing confidence the current production rate ($6.8b, which has increased from ~$5b in 1H21) can also be sustained.
Development Yields Continue to Expand
The yield on cost of new projects has been steady to increasing slightly over the last two years, to 6.8% (from 6.6% 6-12 months ago). This is an excellent outcome in the context of significant industrial yield compression globally. In turn, this has lifted GMG’s development margin to ~60%, as is it developing product significantly higher than market cap rates.
The Company commented that despite increasing materials/construction costs, pre-purchasing and rent growth was sufficiently offsetting these. Given the higher forecast yield on cost and the likelihood of further cap rate compression across the last stated portfolio cap rate of 4.3%, development margins should remain elevated.
Assets Under Management to Continue Growing
Assets Under Management (AUM) in FY21 grew by 12.2% to $57.9b, with the growth driven by revaluations in industrial assets, due to cap rate compression. At the 1Q22 trading update, GMG indicated that it expected AUM of $70b by FY22, which is tracking ahead of the ‘more than $65b’ it indicated at the FY21 results release in August.
There are a number of factors underpinning further expansion in AUM over the medium term.
Strong demand for industrial assets is leading to strong cap rate compression. GMG indicated its global cap rate had compressed 55 basis points to 4.3% over FY21. Although, the Company noted global cap rates were ~4% and in recent months, transactions in Sydney/Melbourne have been <4%. GMG’s platform has the added benefit of being in enviable locations, resulting in rent growth that is ~2x reported income growth. This factor supports the view that AUM growth will be driven by a similar level of revaluations as observed in FY21 ($5.6b in external AUM) and development completions. As such, the FY22 AUM target of $70b appears achievable.
In addition, with the Company noting that its asset divestment program is largely complete; completions likely to expand from ~$4-5b in FY22 to ~$6-7b in FY23; and a further increase in revaluations (driven by underlying fundamentals, rather than further cap rate compression), AUM is likely to reach $80b by FY23, implying 15-20% growth in AUM over two years on a CAGR basis.
Partnerships to Drive Increase in Performance Fees
GMG reported performance fee revenue in FY21 of $149.0m, which was down 28% in comparison to FY20. However, this was due to timing of assessment dates rather than poor performance. In FY21, GMG’s partnerships reported a weighted average total return on net assets of 17.7%. This is an improvement on an already return of 16.6% for FY20 and compares favourably to typical benchmarks of ~9-10%.
The Company indicated that FY22 is likely to be “another very, very strong year” in terms of the expected performance of GMG Partnerships, which will result in an increase in performance fees. Partnership returns per annum have average ~16% over the past four years, and likely to exceed 20% in FY22 with >$5b of revaluation gains likely. This implies performance fees are accruing up to 3x more than fees recognised, further de-risking earnings.
Fundamental View
Notwithstanding that the shares are currently trading on a 1-year forward P/E multiple of ~31x (which is above the upper end of the trading range over the last three years), we consider that further upside is underpinned by:
i. An attractive earnings growth outlook (EPS growth of 13% from FY21-24 on a CAGR basis). To this end, earnings momentum over the medium term is supported by scope for further growth in AUM, positive revaluations, a ramp-up in developments, recovery in performance fees and the inclusion of unrecognised profits in the operating results.
ii. A strong balance sheet and liquidity position, which is supported by ongoing retention of capital to be used in the development pipeline.
iii. Continued strong demand for well-located, quality industrial assets and GMG’s demonstrated ability to acquire assets with high yield potential.
Charting View
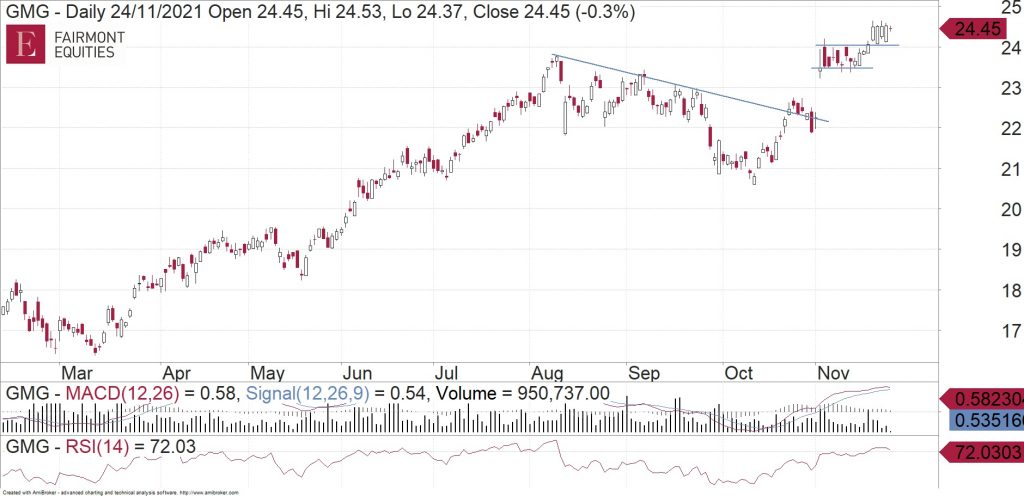
In our charting commentary a few weeks ago in The Dynamic Investor where we noted that GMG was a buying opportunity, we commented that “momentum looks strong here for GMG and it is likely to continue its uptrend. Now that it has also breached the downtrend line that was in place since August, we now have even more confidence that it can head higher”. After the recent gap up, GMG then managed to hold in near the August high quite well. Once it was done with that small consolidation, it then broke higher a few days ago. This is very bullish and it is giving us more confidence that GMG shares can continue to trend higher from here.

Michael Gable is managing director of Fairmont Equities.
Current share prices available here.
You can learn more about technical analysis in this article.
An 8-week FREE TRIAL to The Dynamic Investor can be found HERE.
Would you like us to call you when we have a great idea? Check out our services.
Disclaimer: The information in this article is general advice only. Read our full disclaimer HERE.
Like this article? Share it now on Facebook and Twitter!

