We recently reviewed Genworth Mortgage Insurance Australia (ASX:GMA) after the Company reported its results for the six months to 30 June 2019 (1H19). While the financial performance has been mixed in recent periods, we assessed the GMA’s credentials as a yield play.
By way of background, the Company is the leading provider of Lenders Mortgage Insurance (LMI) in the Australian residential mortgage lending market. It has an estimated market share of approximately 31% of the Australian high loan-to-value ratio mortgage origination market, on the basis of New Insurance Written. In Australia, LMI facilitates residential mortgage lending by transferring risk from lenders (i.e. banks and other financial institutions) to LMI providers. LMI is usually taken out in loans with a loan-to-valuation ratio (LVR) above 80%.
Key Fundamental Drivers of GMA
GMA’s interim results were generally in line with consensus estimates. Key metrics as at 1H19 – Net Earned Premium and Loss Ratio – were within their respective FY19 guidance range. There were two key aspects of the result that, in our view, are crucial in any assessment of GMA’s fundamentals: The trend on the Delinquency Rate and the Surplus Capital position. We discuss each of these in further detail below:
1. The Delinquency Rate May Continue to Deteriorate
The Delinquency Rate is defined as reported delinquent loans insured (i.e. three or more months in arrears) divided by the number of in force policies. After increasing 7 basis points to 0.54% in FY18, due to an increase in the number of lapse policies identified, the Delinquency Rate increased to 0.60% in 1H19. This was reflecting the continued extended ageing of delinquencies due to slower loss management processing by lenders over the past 12-18 months. A further impact on the Delinquency Rate is continued softening cure rates in 1H19 (i.e. the portion of bad loans that reverse). It is a trend that was first identified in 2018.
The Company is aiming to reduce its Delinquency Rate by reducing its exposure to high-end LVR loans (i.e. loans with LVRs of 90% and above) and commensurately, increasing the portion of low-end LVR loans (i.e. loans with LVRs between 0% and 80%).
In regards to this strategy, the key determinant of the future rate of delinquencies is the extent of the downturn in housing prices, as the recent fall in housing prices (relative to 2017, 2018 and in 2019 to date) means that the effective LVR on GMA’s books is now higher than the original LVR (i.e. when the loans were taken for mortgages where valuations (i.e. house prices) were higher). As such, any further decline in the housing market is likely to result in additional increases in the delinquency rate.
2. Strengthened Capital Position Supports Further Capital Management Initiatives
GMA’s regulatory solvency ratio was 2.08x the Prescribed Capital Amount (PCA) as at 30 June 2019 and is well above the target range of 1.32x – 1.44x and has expanded in comparison to recent periods. The Company also has a strong track record of managing the PCA coverage ratio despite undertaking a number of share buybacks, capital returns and special dividends. Recent $100m on-market share buybacks have been completed in late 2017 and late 2018. GMA did not complete the most recent share buyback ($100m, commenced in February 2019) and decided to pay the unpurchased portion of targeted capital return as an unfranked special dividend (21.9 cents per share).
The higher level of surplus capital enables the Company to support further capital initiatives, including another share buyback (approved by shareholders in May 2019) and maintaining a high dividend payout ratio of 50-80% of Net Profit After Tax (NPAT).
Fundamental View
While key investment metrics are generating mixed results, the prospect of ongoing capital management initiatives (in particular $100m share buybacks are expected each year over the next 2-3 years) as well as higher dividend payments (the dividend payout ratio increased to 86% in 1H19, from 71% in 1H18) as well as special dividends, make the investment case appealing, given the Company’s track record in maintaining a high dividend payout ratio and returning capital to shareholders since listing in 2014. At current levels, the forecast yield for FY20 is around 6% (fully franked), with further upside to the yield in the event that a special dividend is paid in FY20.
Accordingly, we consider GMA as an attractive investment for yield-conscious investors.
Further, overhang risk for the stock has reduced, after an agreement was entered into in mid-August for Brookfield Business Partners to purchase all shares in Genworth Mortgage Insurance Canada. This entity is owned by Genworth Financial, who holds approximately 52% of GMA’s issued shares. The implication for GMA from the transaction is that it reduces the likelihood that Genworth Financial would be required to sell a part of its shareholding in GMA in order to increase financial flexibility.
Charting View
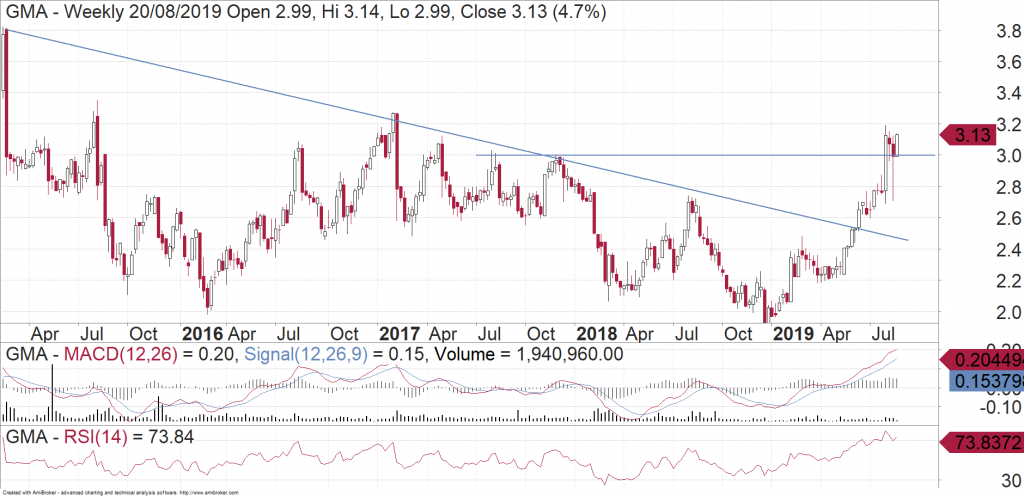
In June we saw GMA break the downtrend that had been in place since the 2015 peak. It has traded very well since then and price action has looked bullish. Shorter-term it looks like we might get some weakness where GMA is at risk of coming back to retest support near $3. Once it gets going again though, we would be targeting resistance up near $3.50.

Michael Gable is managing director of Fairmont Equities.
Current share prices available here.
You can learn more about technical analysis in this article.
An 8-week FREE TRIAL to The Dynamic Investor can be found HERE.
Would you like us to call you when we have a great idea? Check out our services.
Disclaimer: The information in this article is general advice only. Read our full disclaimer HERE.
Like this article? Share it now on Facebook and Twitter!

