

The Telstra share price is once again hitting the headlines after falling more than 10 per cent in the last 3 days. In early 2015, Telstra was trading over $6.60. It is now languishing at levels closer to $4 which means that investors have lost about 40 per cent of their capital in two years. One positive aspect of Telstra is that its chart seems to be a bit easier to read than some other stocks. Certain patterns and charting behaviours within the Telstra chart have provided us clues as to where the price is likely to head. We are once again seeing some signs that the shares are at another turning point. We looked at the Telstra chart in August last year and noted the possibility of it heading under $5. We then revisited the chart in February and warned of even further weakness towards $4.50. Unfortunately, it didn’t spend much time at $4.50 before plummeting towards $4. This was on the back of TPG lobbing a hand grenade into the telecommunications market. Telstra has once again fallen towards a key level and is showing some interesting signs on the chart, hence why it is now worth revisiting the chart.
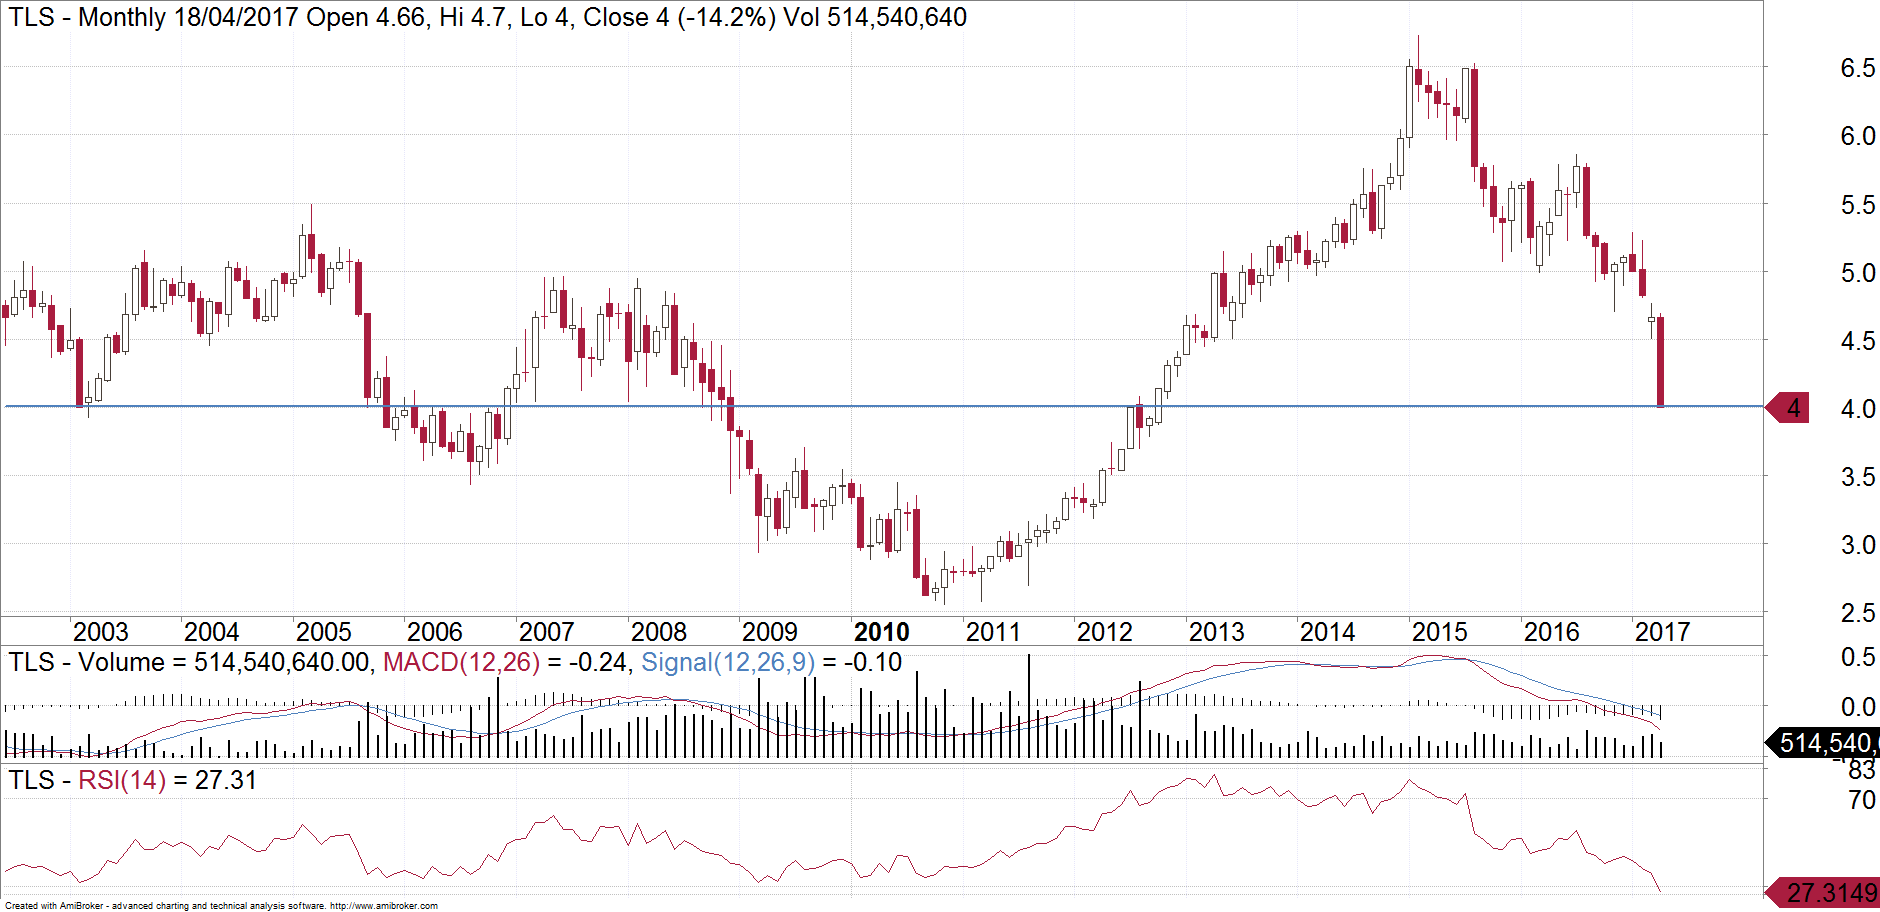
When we look at how Telstra has traded over the last 15 years, we can see that the $4 level has seen its fair share of turning points. As a round number, that also tends to draw in a few buyers. The other interesting point is regarding how far Telstra has retraced its prior rally. That is, we need to measure the distance of the rally that commenced in 2010 when it was trading under $3, up to its peak in 2015. Having now fallen towards $4, Telstra has therefore retraced about 61.8 per cent of this rally. This is known as a Fibonacci retracement and it often leads to support for a stock. When you include franking, Telstra is now yielding over 10 per cent, so it makes sense that this should now draw in some buyers. However, the fundamental growth problems remain and we once again caution investors to chase yield when faced with downside risk to your capital. The technical are now indicating a potential rebound from here to over $4.50 but the risk that Telstra trades with a “3” in front of it remains for now.
Make sure you bookmark our main blog page and come back regularly to check out the other articles and videos. You can also sign up for 8 weeks of our client research for free! Otherwise you can email Michael Gable directly at michael@fairmontequities.com
Disclaimer: The information in this article is general advice only. Read our full disclaimer HERE.
Uniquely combining both Fundamental and Technical Analysis
Not yet a subscriber? Join now for FREE!
Receive our weekly tips and strategies into your inbox each week.
BONUS: Sign up now to download our 21 page Trading Guide.