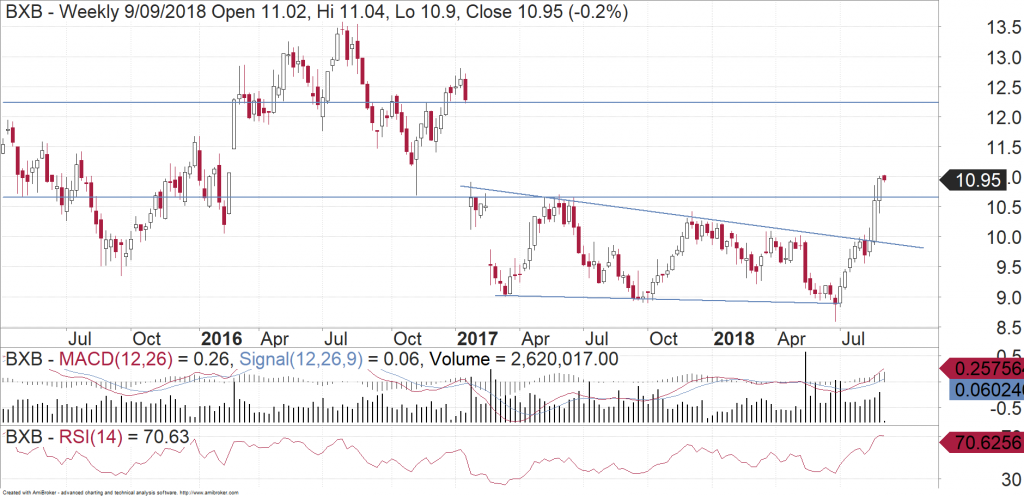
Brambles (ASX:BXB) is a supply chain logistics company. They operate in over 50 countries. Their specialty is in reusable pallets and crates. We look at the chart for BXB and determine where it might head to from here.
Brambles Full Year Results
Brambles reported their full year results at the end of August. Expectations were low going into the result, but revenue growth managed to exceed analyst’s estimates. They also announced a proposed demerger of their IFCO business.
The Brambles Chart
The result saw BXB push through resistance at $10. A week later, it had also exceeded the next resistance level near $10.65. That $10.65 should now act as a support level for BXB. Volume has also been healthy on the way up, which is a bullish sign. We expect BXB to now edge higher from here. Minor resistance will be seen at $11.50. However ultimately, if it can maintain this momentum, we would be looking for BXB to fill the gap that was created in early 2017. This implies possible levels up towards $12.20.

Current share prices available here.
You can learn more about technical analysis in this article.
Michael Gable is managing director of Fairmont Equities.
Sign up to our newsletter. It comes out every week and its free!
Disclaimer: The information in this article is general advice only. Read our full disclaimer HERE.
Like this article? Share it now on Facebook and Twitter!

