

After reporting well in August, Mirvac (MGR) is now trading near multi-year highs. Do the fundamentals stack up at these pricing levels, and what are the charts suggesting for an entry level?
The fundamental viewpoint
Mirvac’s EPS growth guidance of 6-8% for FY18 implies another year of strong EPS growth. While there are market concerns around a weaker level of EPS growth in FY19, driven by weaker Residential divisional earnings (as apartment volumes declines are skewed to Brisbane and Perth projects, which are potentially lower margin), we note that this may be mitigated by higher-than-expected profits from a major leasing deal at the 477 Collins St VIC office asset, where Deloitte has committed to over 22,000m2 for a 12-year term.
While the level of residential lot releases is expected to moderate following a strong FY15-17 period, above-average lot releases during the latter period, as well as factors such as strong gross developer margins, lower competition for sites and reduced market supply (as lending conditions tighten) are supportive of Residential divisional earnings over the next three years.
We consider NTA to be a more appropriate measure of value for Mirvac than the price-to-earnings ratio. To this end, Mirvac continues to generate NTA growth, with NTA up 6% and 11% over the past 6 months and 12 months, respectively, to $2.13. The growth in NTA has been driven by revaluation gains on investment properties and contribution from retained earnings. Given that the Company’s relatively new office portfolio is primarily located in NSW and VIC, there is further upside to NTA from revaluations on the basis of recent market transactions. Also, the skew of the development pipeline towards Office is expected to contribute to NTA growth.
Gearing levels remain at the lower end of both the targeted range (20-30%) and the gearing levels for REIT peers.
We also note that the Company continues to offer an attractive 1-year forward distribution yield of ~5%.
The charting view
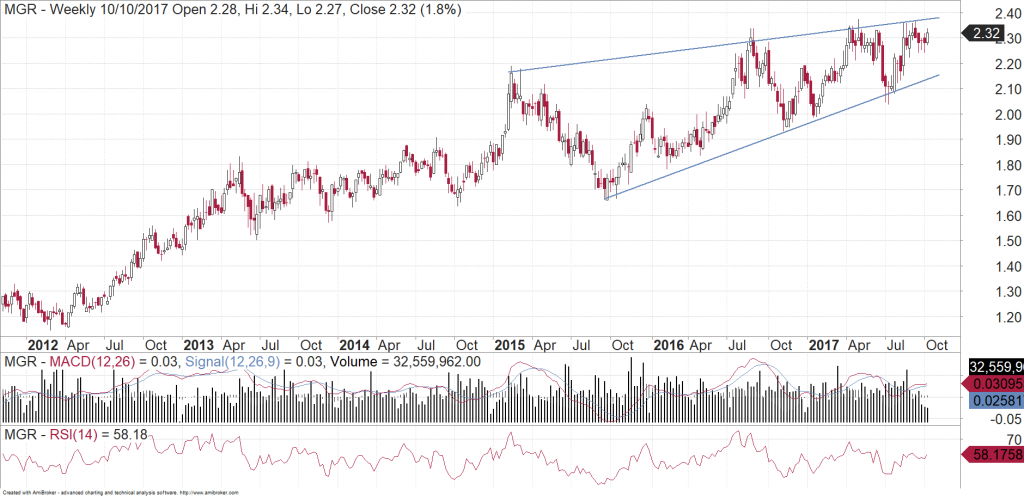
Price action for Mirvac in the last two years is starting to resemble that of a rising wedge, which is a topping pattern. At the moment, the stock is near the top of the range so it would be difficult to chase it here. If the stock falls back towards support near $2.15 then that would be a better entry. However, investors would be advised remain very cautious around that level as a break under the support line could see the stock fall back towards the base of that wedge. That implies levels near $1.70. Having said all that, if Mirvac can break above the upper resistance line, then that may draw in some further buying and investors may wish to jump on-board and ride the momentum.
*The above article is an extract from our client research dated 26 September 2017.
Michael Gable is managing director of Fairmont Equities.
Sign up to our newsletter. It comes out every week and its free! You can leave your email with us via the form on the right-hand side of this page.
Disclaimer: The information in this article is general advice only. Read our full disclaimer HERE.
Like this article? Share it now on Facebook and Twitter!