
This post formed the basis of an article that appeared in the August edition of the ASX Investor Update on 9 August 2016.
Michael Gable is a regular expert contributor to the ASX. You can access the ASX version of the article HERE.
Earlier this year as the negativity on the resources sector hit its heights, share prices hit their lows. Mining stocks have done very well since the beginning of the year, with share prices moving higher. However it is the mining services sector which has done even better. This sector is arguably more leveraged to the prospects of the big miners so trading the mining services stocks this year has been very profitable. Even after an impressive run, it is still worth having a look at the share price action for the bigger names. Our philosophy to investing at Fairmont Equities is to ensure that both fundamentals and technicals are looking good. Some of these companies may be well run, but their customers may be struggling. The miners are also price takers, not price makers. Decent growth in commodities prices could also be years away, which means that share prices will remain volatile. As a result, these stocks might be more suitable for investors who can appreciate a bit of risk, and are nimble and knowledgeable enough to trade back out when the run is over.
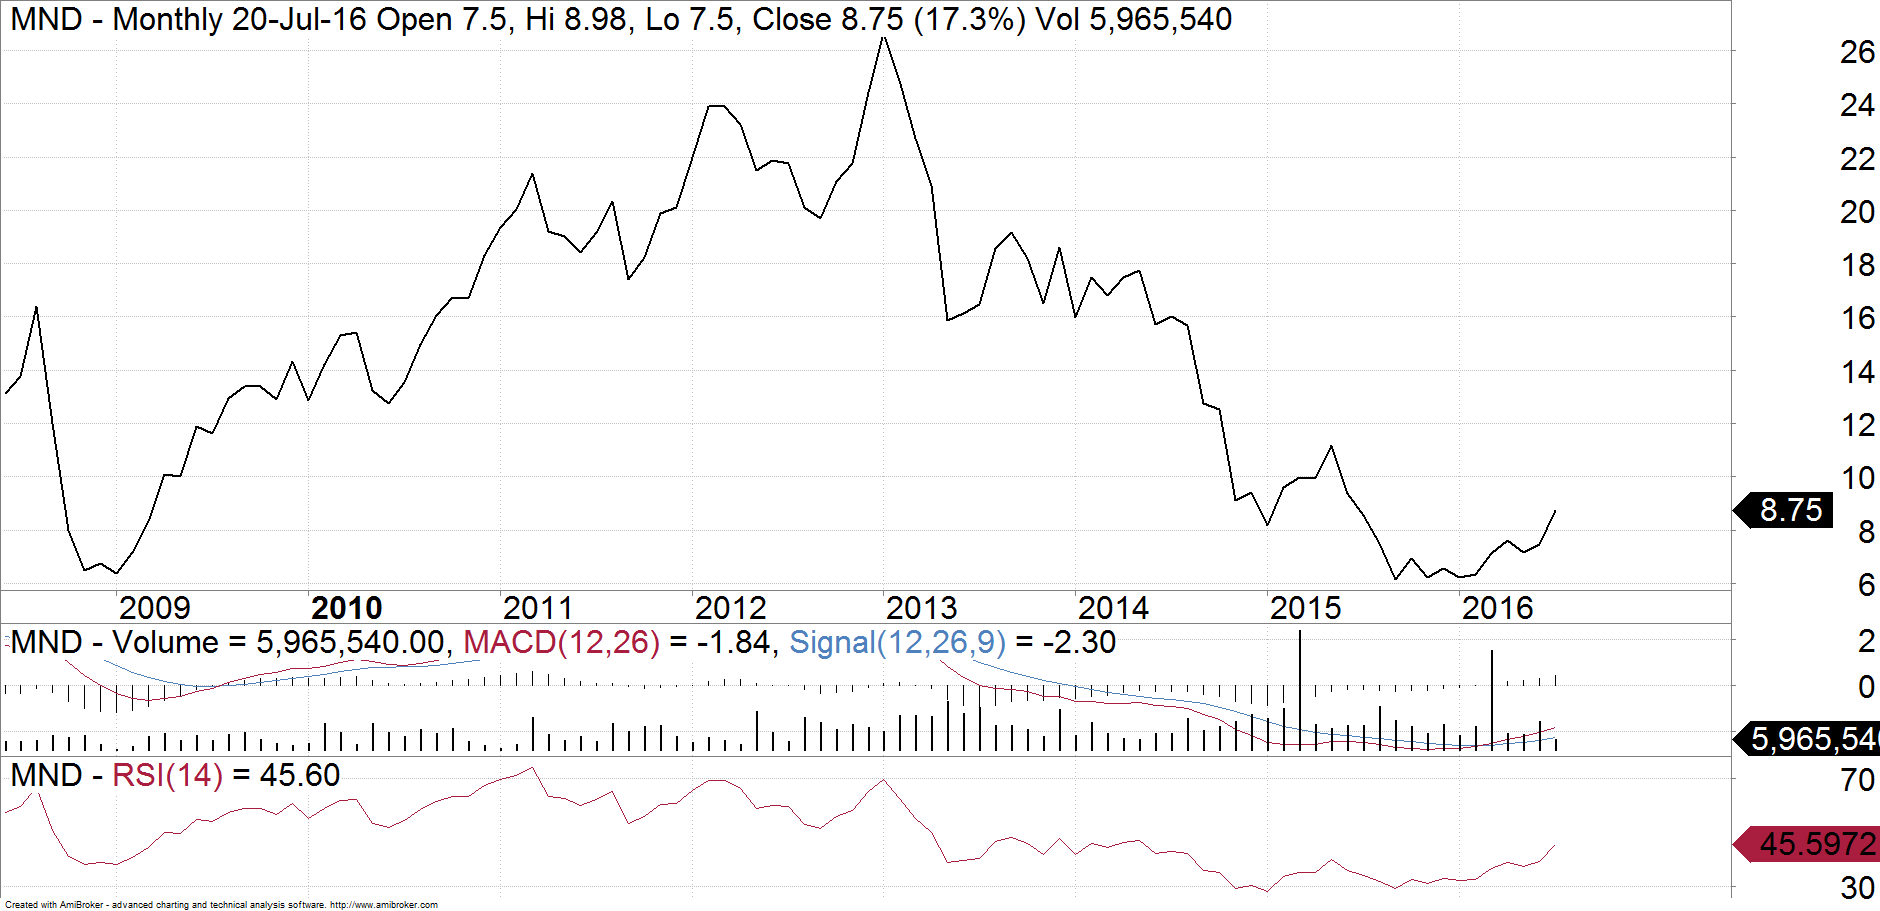
Monadelphous (MND)
Monadelphous has been the market darling of the sector. Not only did it see its share price increase more than 4 fold from the GFC lows, but it was able to pay an attractive, fully franked dividend the whole time. This made it particularly attractive to the SMSF sector of the investment community. The fall from grace has been fairly savage though, with the stock coming back to the GFC lows during 2015. However, during the last half of 2015, we managed to see Monadelphous bottom out and the downwards momentum to tail off. This year has seen the stock head higher, breaking that 3 year downtrend. We are also seeing trend change signals triggered, even on a long term basis such this monthly chart. On a shorter term time frame, Monadelphous had been forming an ascending triangle over the last few months. It cannot be seen clearly on this monthly chart, but last month we got a further buy signal as it broke through resistance near $8.Since then it has continued to push higher. Based on current performance, we would expect to see it trade up towards an initial target near $10. If it clears that, then we have further resistance levels up at $12 and $16. However a likely scenario is that Monadelphous trades up towards one of these first two levels and then spends more time being range bound as it builds a longer term base.
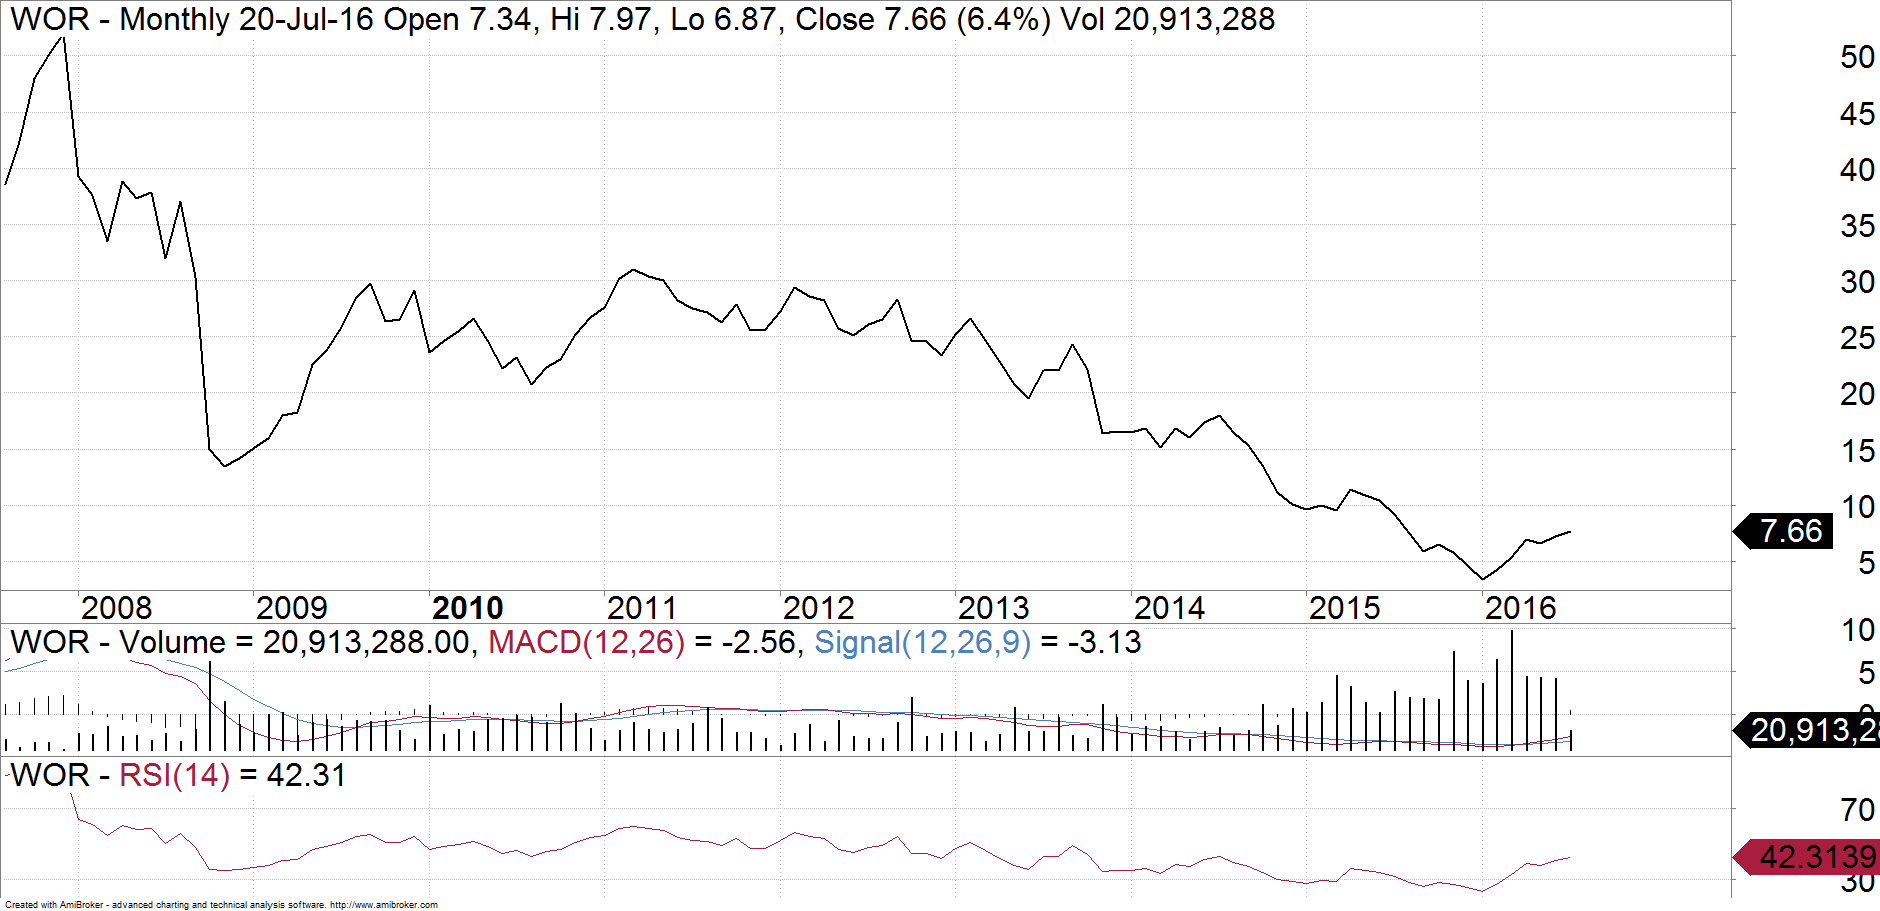
WorleyParsons (WOR)
WorleyParsons is heavily correlated to oil and we all know what has happened to the oil price. This monthly chart makes it easier to see the volume levels in the stock. We can see a clear increase as it gets to the low and then bounces off it. This firstly indicates potential accumulation down here as WorleyParsons was perhaps being viewed as finally oversold by the market. In terms of our Relative Strength Index (RSI), it has shown up as being oversold. The stock is still in a downtrend though so we need to be wary as to whether a good low is actually in place. I can see some big resistance near the $8 region so I think that until it clears that, we need to be cautious on WorleyParsons.
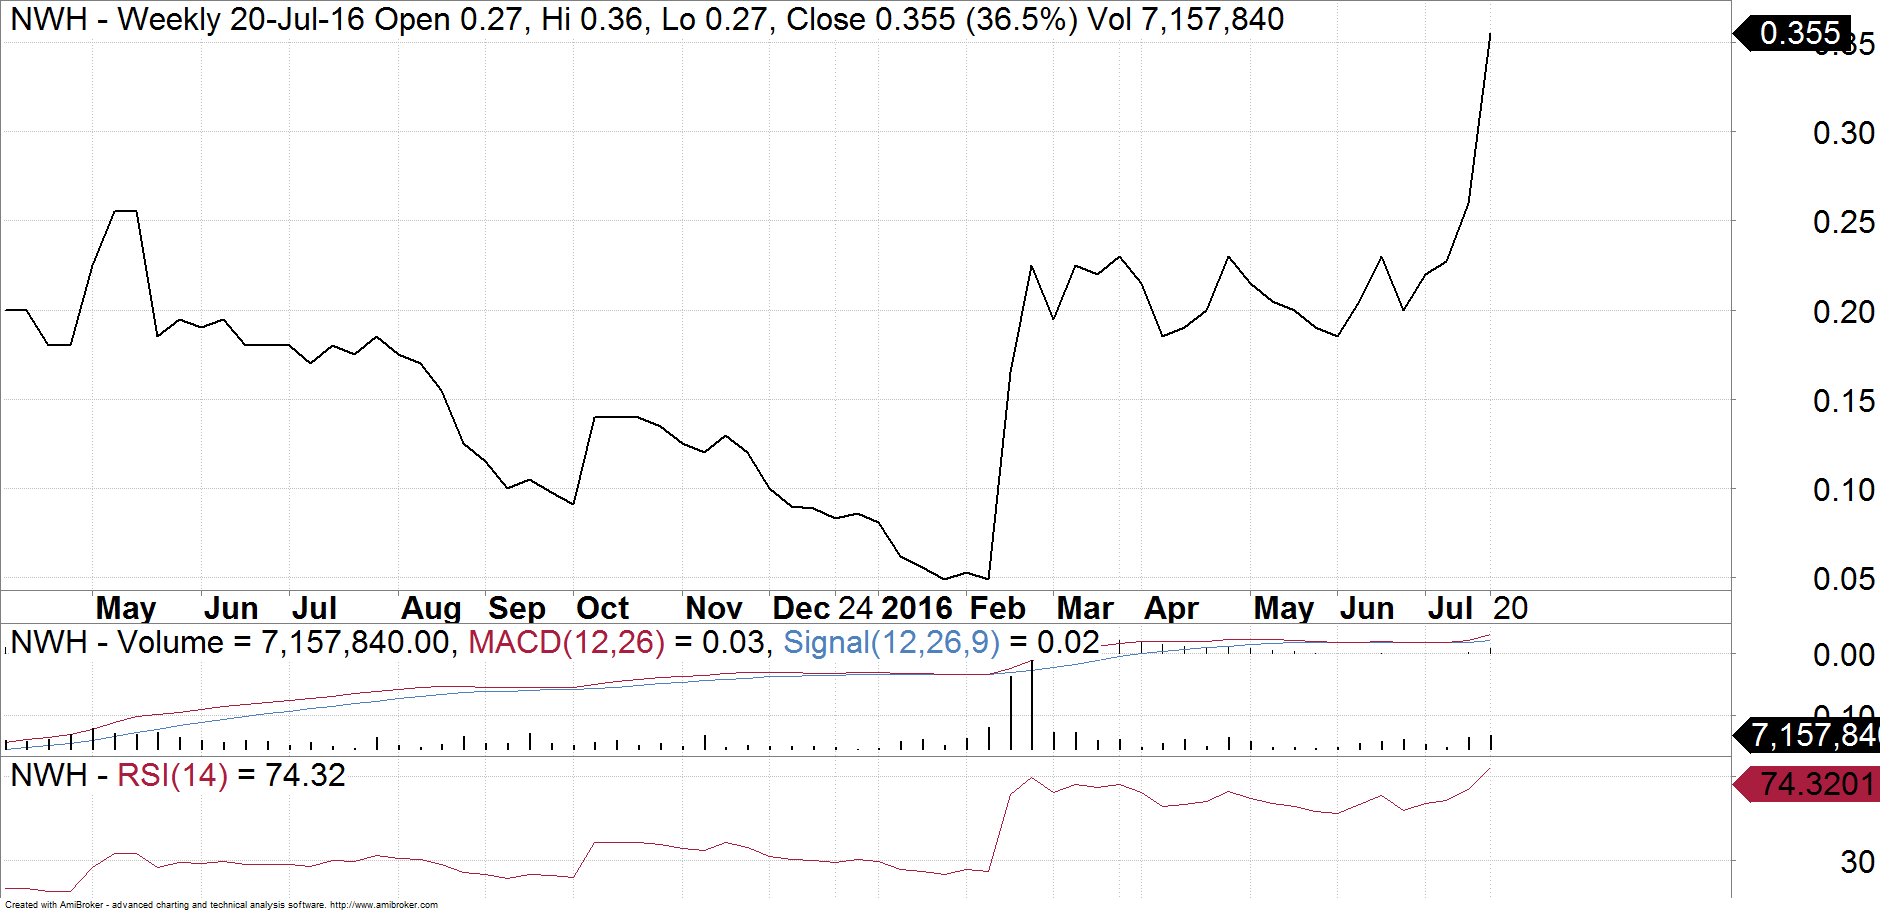
NRW Holdings (NWH)
NRW Holdings has suffered more than the larger mining services companies. Compared to its peak 4 years ago, it has shed over 90 per cent of its value. This means that it would be hard to make big predictions on the long term price targets but on a shorter timeframe we can see some very interesting price action occur. This could lead to some trading opportunities. On this weekly chart we can see the shares bounce strongly off their lows. Within a week, the stock managed to increase its share price by over 3 times. This was also done on very strong volume. Instead of being heavily sold into, you will notice that the share price essentially drifted sideways for a few months. This is a bullish sign as the sellers are unable to push the price any lower. In this situation, it is just a case of waiting for the break and following the momentum. We can now see that happening so traders could look to pick up NWH and run with it until it reverses again.
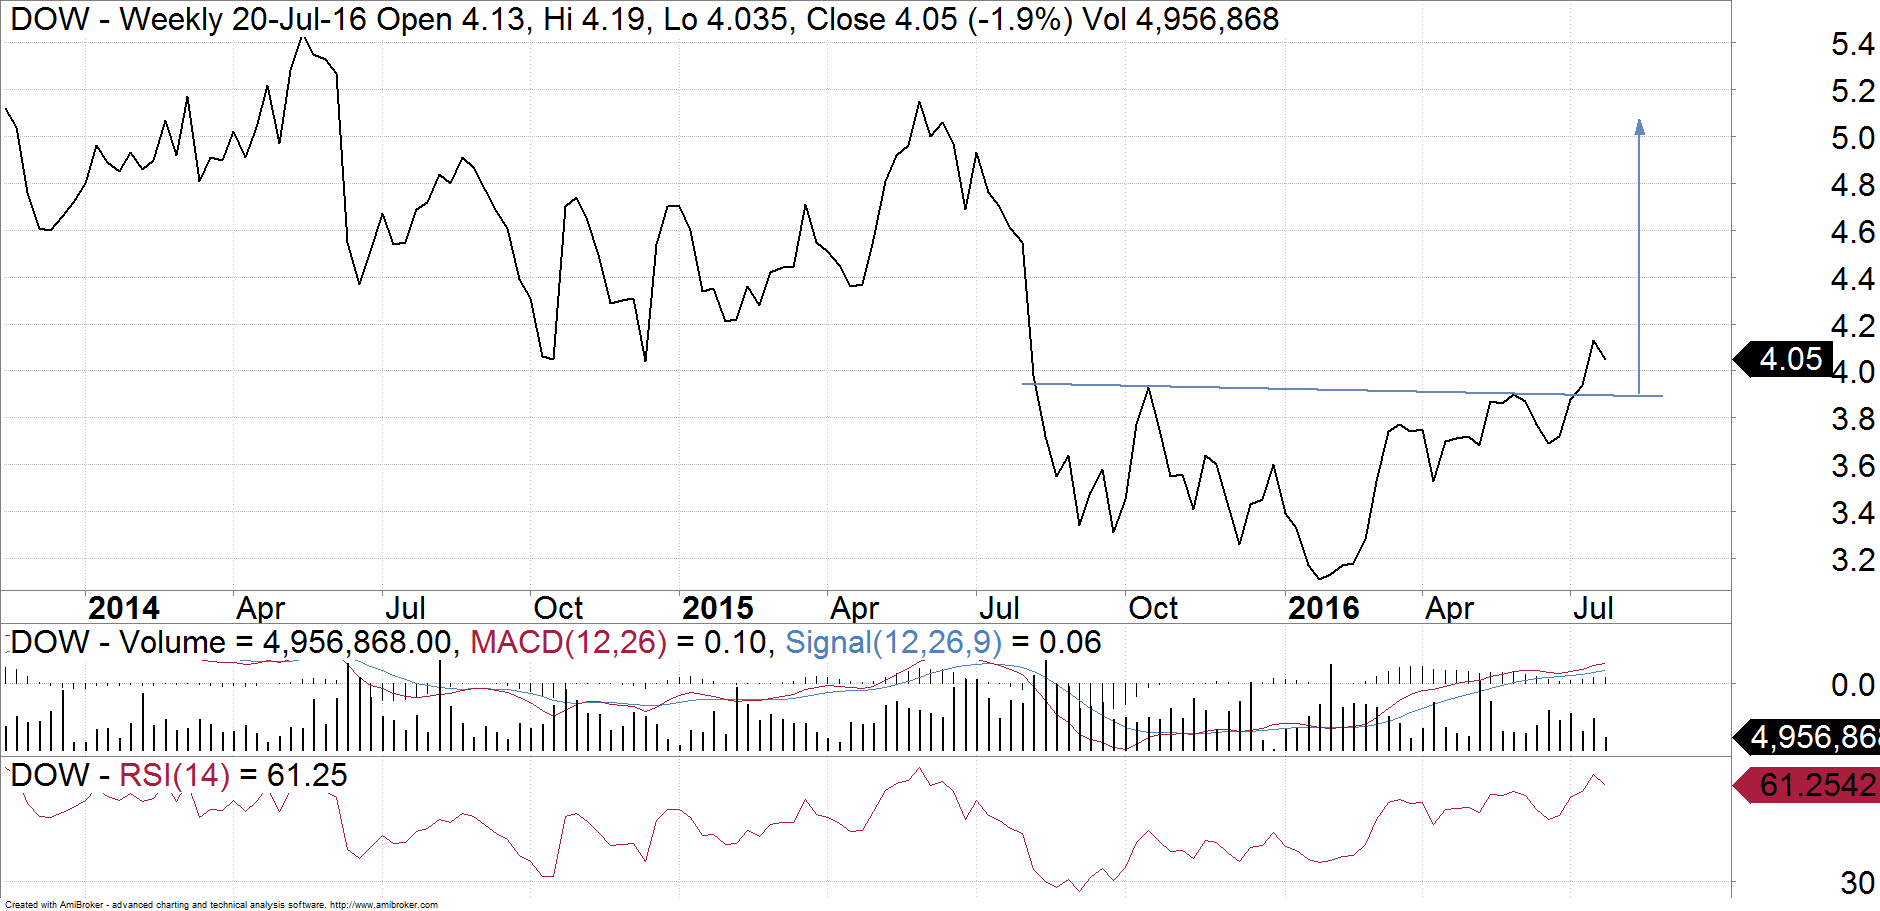
Downder EDI (DOW)
After the GFC, Downer hit a low in 2011 before mildly bouncing again. Earlier this year we saw Downer retest that low and bounce once again, which is a positive sign. The stock has been heading higher this year and we still see further upside for the next several months. Looking at this weekly chart, we can see the formation of an inverse head and shoulders. This implies a low is in place for now and Downer should continue to move higher. With an inverse head and shoulders, we can extrapolate a target and in this case we are looking at levels as high as $5.
Like with all sectors of the market, not all stocks are created equal. We can see more opportunity in some mining services stocks over others, but the common theme is that this is a tough industry. Be clear about your strategy and understand the limitations.
Make sure you bookmark our main blog page and come back regularly to check out the other articles and videos. You can also sign up for 8 weeks of our client research for free!
Disclaimer: The information in this article is general advice only. Read our full disclaimer HERE.