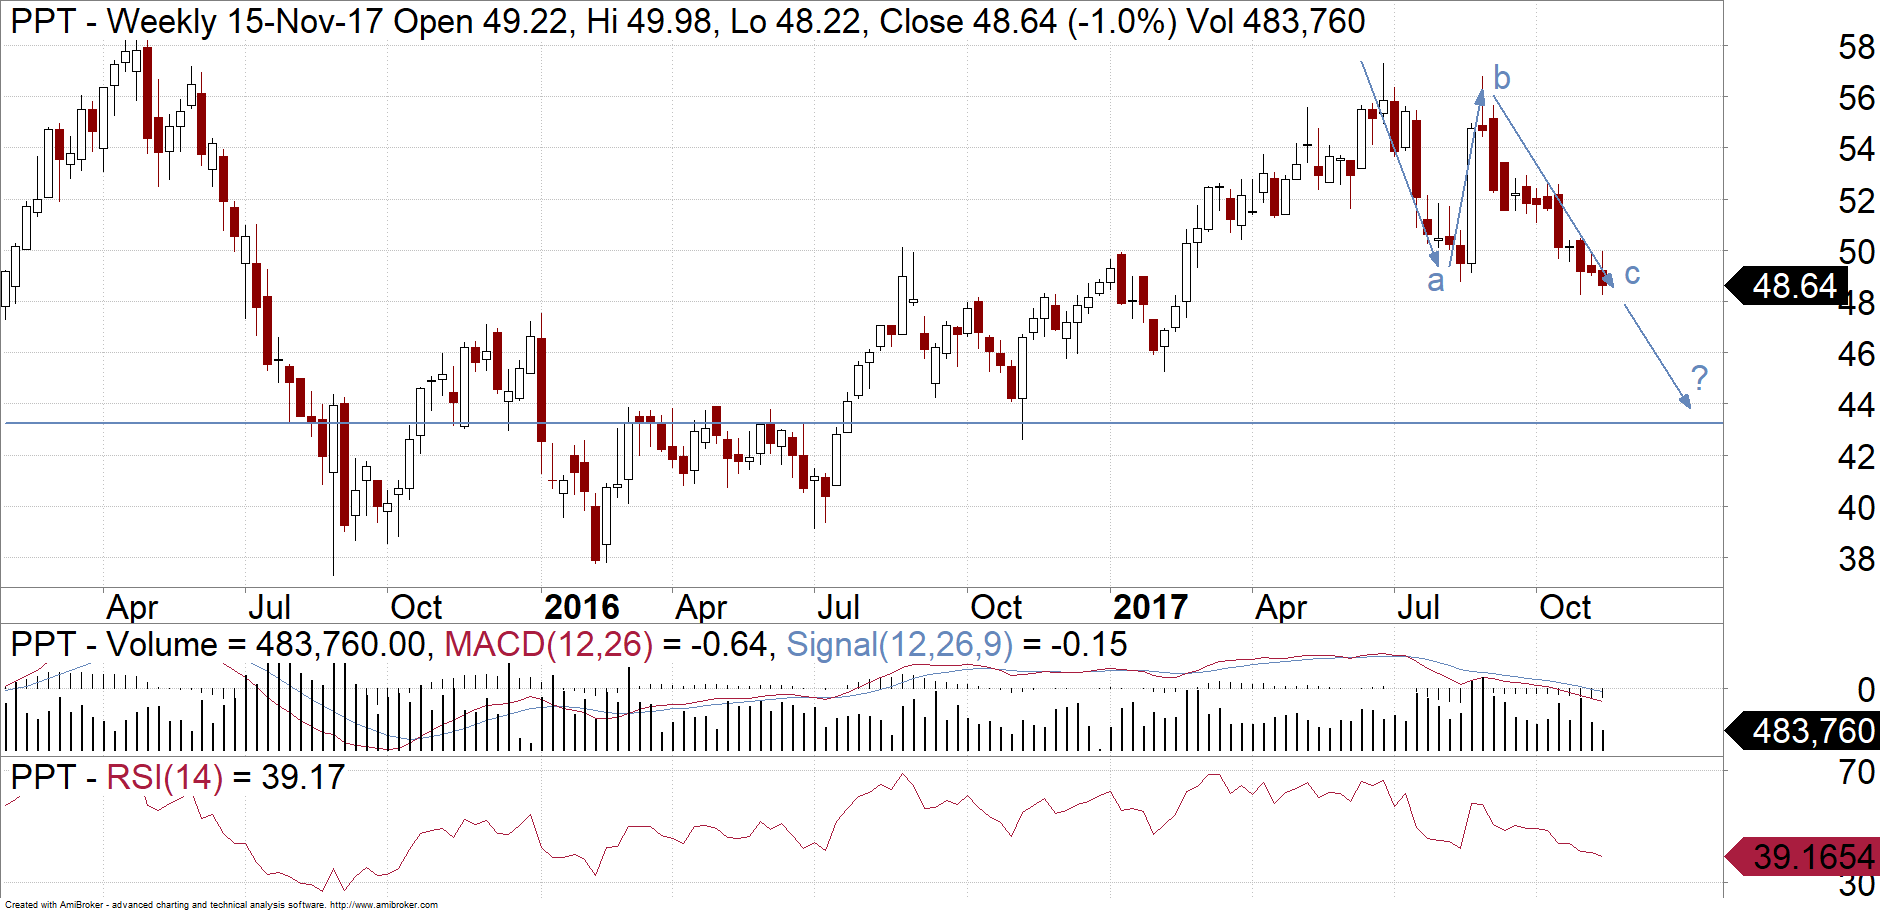
The share price of Perpetual (ASX:PPT) has been underperforming the S&P/ASX 200. We look at the reasons why and whether the chart for PPT shows some support building at current levels.
A background on Perpetual
PPT is a wealth management company that operates three divisions, namely Perpetual Investments, Perpetual Private and Perpetual Corporate Trust. Perpetual Investments provides investment management services on behalf of private, corporate, superannuation and institutional clients. It is the main earnings driver, accounting for 60% of group profit before tax. Australian equity managed funds comprise 72% of total funds under management (FUM). As at 30 September 2017, PPT had FUM of $31.0b.
Having recently reviewed PPT, our key concern with the stock at that time was the flat performance in the Perpetual Investments division. This was evidenced by a continuation of net outflows over the past two years. Typically it has been a stock that was well leveraged to the positive movements in the overall market. However PPT’s recent share price decline has contrasted the surge in the local Index towards 6000 over the last couple of months. We list a number of factors likely to underpin our still cautious view on the stock.
Why we are cautious
- In the most recent quarterly Funds Under Management (FUM) update for the September 2017 quarter, PPT reported outflows of $0.7b. This was worse than the market’s expectations. And it was the third consecutive quarter of outflows from Australian Equities. The continuation of outflows is disappointing given that the September quarter is usually a seasonally strong quarter. This is due to the reinvestment of the June retail cash distributions.
- The revenue impact of lower FuM is likely to impact profitability. This is given that the decline in FUM is not due to a significant market downturn and therefore not likely to be matched by cost cutting. Asset managers typically take action to reduce its cost base (e.g. cutting staff in the investments teams) when there is a significant and prolonged market downturn. EBITDA Margin for Perpetual Investments have already come under pressure from performance fees. This saw the EBITDA margin decline to 51.6% in 2H17, from 52.8% in 1H17.
- In addition to the challenges for the Perpetual Investments division, PPT is having mixed success with its other divisions. Firstly, while the Perpetual Private division is delivering growth, there is a lower margin generated from this division in comparison to Perpetual Investments. This means that Perpetual Private is unlikely to be a major earnings driver for the group. Secondly, the global equity fund remains a work in progress. While PPT’s global equities fund has a strong track record (5-year performance +3.5% ahead of benchmark), fund flows into the global strategy remain subdued. FUM in Global Equities have remained flat at $1.3b since 30 September 2015. With Australian funds approaching capacity, PPT needs the global equities fund to generate net flows.
The Perpetual share price chart
After pushing through $58 in 2015, the shares then fall to under $40 in the space of 4 months. Two years later they managed to get within a dollar of that 2015 peak, but have been sold off again. The sell-off in the last few months hasn’t been as steep as that in 2015. At the moment it looks like PPT has pulled back in 3 waves, forming an “abc” correction where “wave a” equals “wave c”. This means that PPT might find some support here. However, there is a risk it comes back a further and a break of support near $48 could imply a move back towards $43. So from a charting perspective, PPT is in “wait and see” mode.

Click here for the current (ASX:PPT) share price on the ASX website.
Michael Gable is managing director of Fairmont Equities.
Sign up to our newsletter. It comes out every week and its free!
Disclaimer: The information in this article is general advice only. Read our full disclaimer HERE.
Like this article? Share it now on Facebook and Twitter!

