

Moving averages are a common tool used by technical analysts to identify the trend of a stock price or index. Two common examples which are used is the simple moving average and the exponential moving average. The simple moving average uses all the data point in equal weight. However, the exponential moving average focuses more weight on the recent price. Moving averages can be used for the period the investor wants to analyse. Most commonly used is the 50 or 200 day moving average. Traders though can set up the moving average to whatever period they like.
Example of how to calculate simple moving price average
If we were to calculate the moving average of the last 5 days we would use closing prices of last 5 days.
Daily closing prices
Day 1 = 65.03
Day 2 = 65.70
Day 3 = 65.00
Day 4 = 64.37
Day 5 = 65.00
Day 6 = 64.37
Day 7 = 63.50
The first day of the five day simple moving average is 65.03 + 65.70 + 65.00 + 64.37 + 65.00 / 5 = 65.02
The second day if the five day moving average will use day 2 data onwards ie 65.70 + 65.00 + 64.37 + 65.00 + 64.57 /5 = 64.88
The third day of the moving average would use the data from day 3 onwards for the next 5 days etc
Example of how to calculate the exponential moving average.
This uses a smoothly factor so focus is on the most recently prices.
EMA = (today’s closing price * k) + (previous EMA * (1-K))
K = 2/(number of days in EMA+1)
In this example we will use the 5 day EMA with the data above
For the first EMA calculation you can just use the average of all the closing price for the period selected
1st EMA value will be the average of 1st closing days = 65.03 + 65.70 +65.00 +64.37 +65.00 /5 = 65.02
2nd EMA value is: (Day 6 closing price =64.37)
EMA = (today’s closing price * k) + (previous EMA * (1-K))
=64.37 * (2/5+1) + (65.02 *(1 – 2/5+1))
=64.8033
Use this formula and calculate all the values for the periods for the EMA
What does the exponential moving average identify?
Traders can use the exponential moving average to determine if a stock is in an uptrend or down trend. When the stock is trading below the EMA it can indicate the stock is predicted to fall. If the stock is trading above the EMA line then it can indicate the stock is predicted to rise.
The EMA line can also indicate support and resistant lines. Support lines may indicate how far the stock will fall. Resistance lines can indicate how far the stocks will reach.
Example of Exponential moving average on a stock – Boral – (ASX:BLD)
On the below example, we have plotted a 50 day EMA line and BLD is trading above that indicating the stock is moving towards an upwards trend.
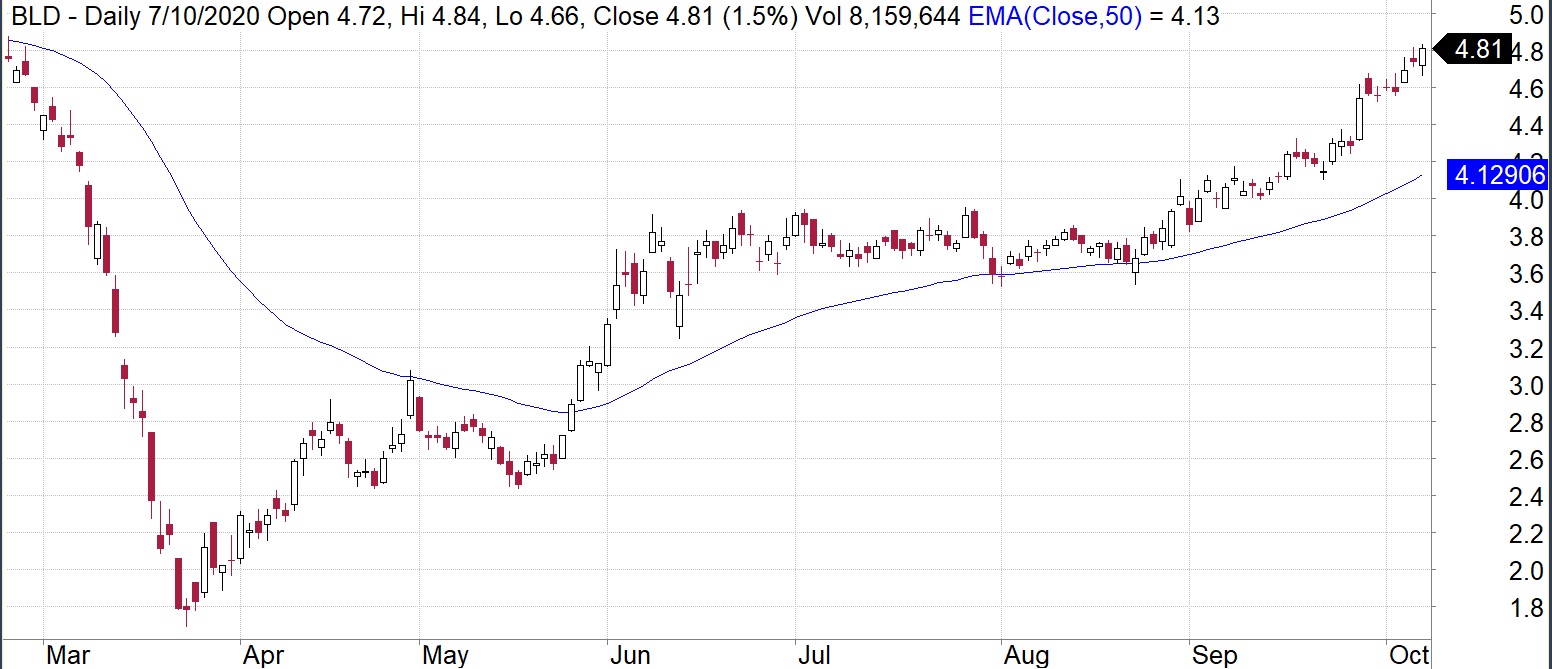
Source: Amibroker
Lauren Hua is a private client adviser at Fairmont Equities.
An 8-week FREE TRIAL to The Dynamic Investor can be found HERE.
Would you like us to call you when we have a great idea? Check out our services.
Disclaimer: The information in this article is general advice only. Read our full disclaimer HERE.
Like this article? Share it now on Facebook and Twitter!