

Technical analysts use various tools to gauge the sentiment of a particular stock or index. One momentum indicator they may use is Relative Strength Indicator (RSI). It was developed by J.Welles Wilders in his book in 1978 and it is still popular with current traders.
What is a Relative Strength Index (RSI)?
The RSI is a technical momentum indicator which identifies when a stock/index has been oversold or overbought. This indicator measures the speed and change of price movements. It measures this by comparing the days the stock has closed higher against the days the stock has closed lower.
To calculate the RSI you need to calculate the RS (Relative Strength) first. The period which is commonly used is 14 days.
RS = average of gains during N period/ average losses during N period
Using the values of RS we calculate the RSI
RSI = 100 – { 100*(1+RS) }
How to read the RSI
When the RSI is above 70 then it is considered overbought. When the RSI is below 30 it is considered oversold.
When the RSI indicates the stock is oversold it could demonstrate the price may increase in the future so it a good opportunity for traders to buy more of that stock.
When the RSI indicates that the stock is overbought it could signify the price might decrease soon.
Example:
In the example below we can see Northern Star (ASX:NST) was overbought in Jul and this was indicated on the RSI chart as it was above 70. We can then see on the stock chart that NST had a price reversal and it was sold off.
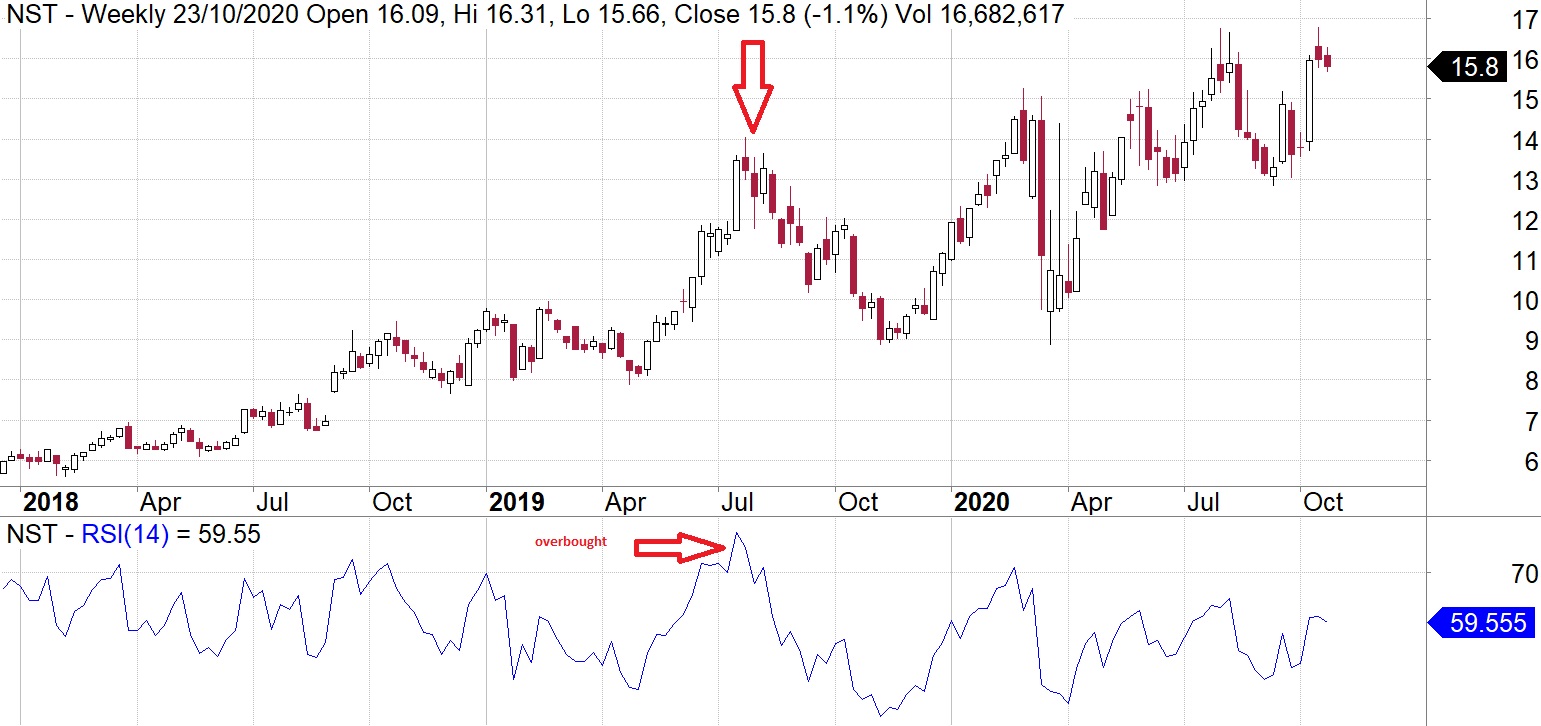
Source:Amibroker
What does divergence of the RSI mean?
A bullish divergence occurs when the price of the stock or index is making lower lows but the RSI indicator is indicating higher lows. This could indicate the trend of the stock price is reversing and the stock price could head up higher.
A bearish divergence occurs when the stock price is showing higher highs but the RSI is showing lower highs. This could indicate the stock may fall and the upwards trend is not as strong as first thought.
Limitations of RSI
The RSI has its limitations as it can give some misleading signals. When a stock or index is in a strong upwards or downwards trend, the RSI could reflect this security as overbought or oversold for a long time. Hence this indication is not accurate when there is a strong trend. For example, in May 2020, Afterpay (APT) shares became “overbought” on the daily chart as they pushed through $40. Nearly 6 months later, the shares are trading over $100 and still look overbought according to the RSI. Traders should therefore use this indicator in conjunction with others to get a more precise picture.
Lauren Hua is a private client adviser at Fairmont Equities.
An 8-week FREE TRIAL to The Dynamic Investor can be found HERE.
Would you like us to call you when we have a great idea? Check out our services.
Disclaimer: The information in this article is general advice only. Read our full disclaimer HERE.
Like this article? Share it now on Facebook and Twitter!