Before you read on, let us offer you a bonus
Receive:
- Our special trading guide on how to Buy and Sell Stocks
- 8 weeks of our research
Since the start of 2022, the Australian share market has easily outperformed the US. A big contributor to this has been the out-performance of resource stocks on the ASX. A number of factors have underpinned their out-performance. These include, but are not limited to:
- Years of under-investment has resulted in dwindling supplies
- Increasing demand for raw materials
- A falling US dollar
However, there is a $6b miner, that is cashed up and profitable, that hasn't enjoyed the same level of gains these past 12 months - Lynas Rare Earths (ASX:LYC).
Lynas is the largest producer of rare earths outside of China. Because what it produces is so critical for western governments to wean themselves off Chinese dependency, in June 2022 it won a $US120 million contract with the US Department of Defence to establish a refinery on their soil.
Despite this, the share price has trended lower. This has been due to a combination of falling prices for rare earths, an announcement that Tesla will attempt to reduce the use of rare earths in the future, and the uncertainty in the commissioning of a new processing plant in Kalgoorlie as a replacement for their Malaysian plant.
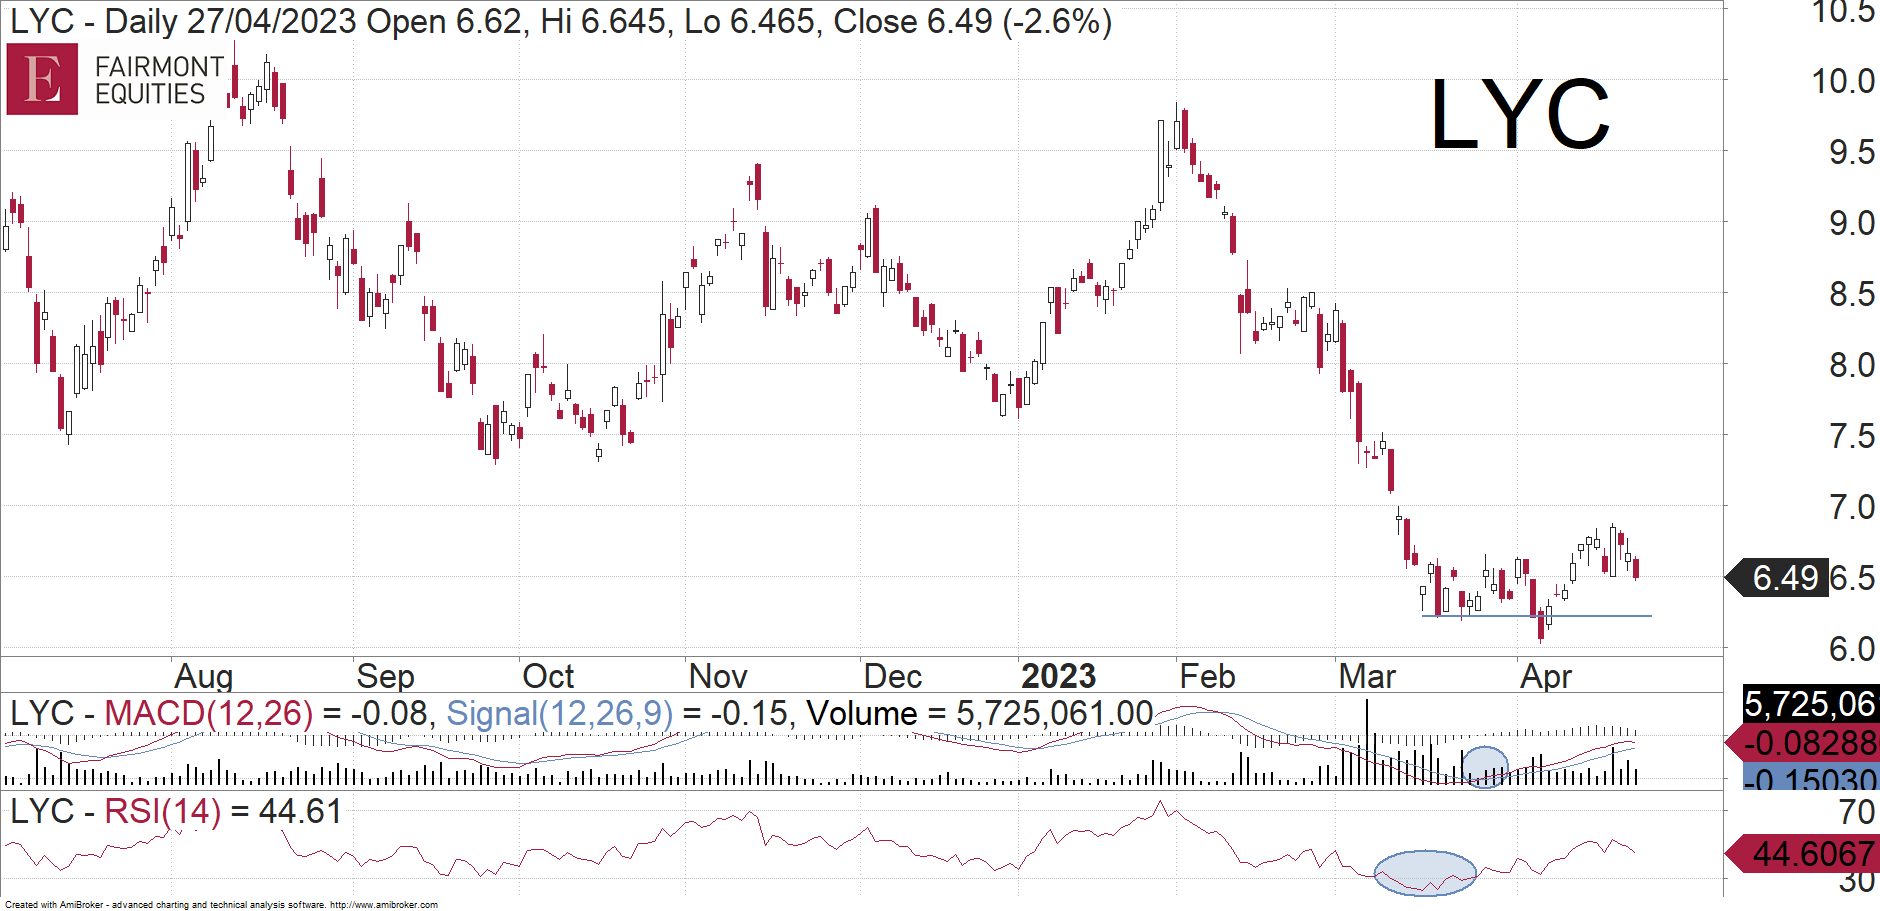
As a result, the past few months has seen the share price fall from the high $9’s to the low $6’s. However, the share price chart is now indicating to us that the declines are overdone and the share price is ready to climb a wall of worry. There is a high possibility here that the market has oversold Lynas shares and that too much negativity is already priced into the stock.
After falling sharply in the past few months, we can see LYC then spent the past few weeks forming a small base by trading sideways near $6.50. It made a false break to the downside on 6 April (trading under the blue line) before rallying higher again. A false break is when a stock looks to have fallen under a support level, only for it to be quickly bought up. It is a result of panicked investors giving up on the stock too late in a downtrend while the smart money moves in to take advantage of that liquidity. A couple of weeks ago it then popped out to the upside of the base. We also have buy signals on the MACD and RSI (circled). This was then followed by a quarterly update from the Company where the collective response from analysts was along the lines of "better than expected".
All this price action looks very bullish and we expect a recovery here. Current levels represent a buying opportunity.

Looking for more ideas? Sign up now and we will send to you:

"Michael’s analysis is concise and easy to understand for any level of investor. I’ve gained more from his free content alone than many other paid services I’ve tried. Highly recommend for anyone seeking to gain an understanding of technical analysis and how to read a chart." Leigh McLaughlan, Redcliffe QLD
"Michael's ability for technical analysis is exceptional and has easy to understand fundamentals in the reports." Diane Partridge, Walcha NSW
“The weekly reports are really good and useful. They offer a great deal of background information and educate us well” Michael Burnicle, Mudgee NSW
Michael's analysis has been featured in:

Thousands of investors have relied on our charting analysis since 2013.
Isn't it time for you to also add that extra edge to your investing?
Sign up now!
Receive:
- Our special trading guide on how to Buy and Sell Stocks
- 8 weeks of our research
Fairmont Equities Australia Pty Ltd (ACN 615 592 802) is the holder of an Australian Financial Services Licence (AFSL 494022) and is licensed to provide general advice.
The information contained in this report is general information only and is copywrite to Fairmont Equities. Fairmont Equities reserves all intellectual property rights. This report should not be interpreted as one that provides personal financial or investment advice. Any examples presented are for illustration purposes only. Past performance is not a reliable indicator of future performance.
No person, persons or organisation should invest monies or take action on the reliance of the material contained in this report, but instead should satisfy themselves independently (whether by expert advice or others) of the appropriateness of any such action. Fairmont Equities, its directors and/or officers accept no responsibility for the accuracy, completeness or timeliness of the information contained in the report.
* All share price charts are courtesy of AmiBroker
