

What is the Stochastic Oscillator
Indicators can be leading or lagging. The difference is that leading indicators gives signals before the uptrend or reversal occurs and a lagging indicator gives signals after the trend has started. The downside of a lagging indicator is that they identify trends that have already started so there is less profit to be made.
Leading indicators can identify the trend before they take place. However, they should be used in conjunction with moving averages and candle stick charts to filter out fake signals. The Stochastic Oscillator is an example of a leading indicator which can identify trends before they occur. This indicator follows the momentum of the price and this indicator can be used as a prediction of the change of the price direction. Momentum means the speed of price changes. If prices are close to all time highs, it shows a sell signal as the marker will reverse if the stock is overbought. If prices are closer to the historical minimum it is a good time to buy as the stock will probably go up.
Formula
There are two lines in the indicator, %K line and %D line.
% K= {(Current Close-Lowest Low)/(Highest High – Lowest Low)} *100
The default period of %K is 14 days. %K analyses the 14 periods using the recent close, the highest high and lowest low over these 14 days.
%D = 5 day SMA of %K
Interpreting the Stochastic Oscillator
Values of the Stochastic oscillator range from 0-100.
When the stochastic reading %K is above 80 it is signalling the market is overbought. When the reading is 20 and below, it is indicating the market is oversold.
The %D line should also be used in the analysis so when the indicator is below 20 and the %K line crosses above the % D line it indicates a buy signal.
When the stochastic indicator has a reading of 80 and above and %K crosses below %D then this is a sell signal.
Some examples using the Stochastic Oscillator
Let’s use an example with CBA to calculate the stochastic number.
Using the last 14 days, the last closing price was $75.03, the highest high is $77.66 and the lowest low is $74.61.
Using the formula % K= {(Current Close-Lowest Low)/(Highest High – Lowest Low)} *100
%K = {(75.03-74.61)/(77.66-74.61)}*100 = 13.77%
This number indicates a low stochastic value which signifies strong downward momentum.
In another example, if we use the Stochastic Oscillator with 5 Day SMA of %K we can identify buy and sell signals.
%K is the red line and %D is the blue line.
In the below example you can see the stochastic oscillator fall below 20 and %K (red line) cross over %D (blue line) indicating a buy signal and you can see the price of the stock increases after the cross over.
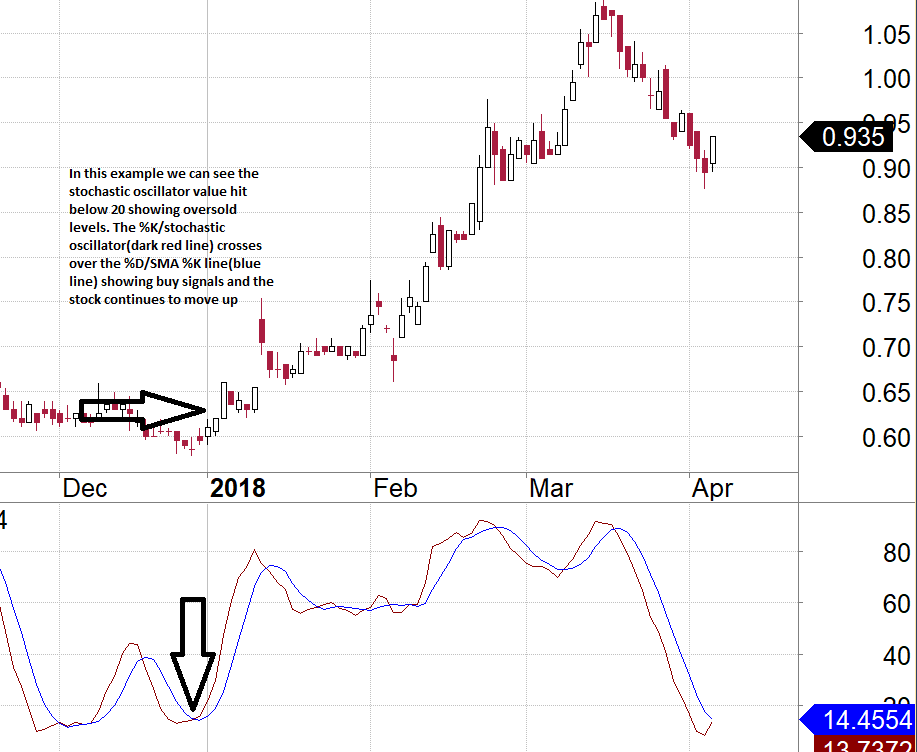 Source: Amibroker
If the stochastic value is above 80 indicating over brought levels and the %K line crosses below the %D line then this indicates a sell signal.
 Source: Amibroker
Lauren Hua is a private client adviser at Fairmont Equities.
Sign up to our newsletter. It comes out every week and its free! You can leave your email with us via the form on the right-hand side of this page.
Otherwise you can email us at mail@fairmontequities.com
Disclaimer: The information in this article is general advice only. Read our full disclaimer HERE.
Like this article? Share it now on Facebook and Twitter!