
Investors in SAI Global (SAI) were relieved after last week’s results to see earnings exceed previous guidance. The stock has fallen quite a way since private equity’s proposal two years ago saw the share price exceed $5. With the company undergoing a transformation and believing that the worst is behind them, do the charts tell us whether now is the right time to get involved and enjoy some significant upside?
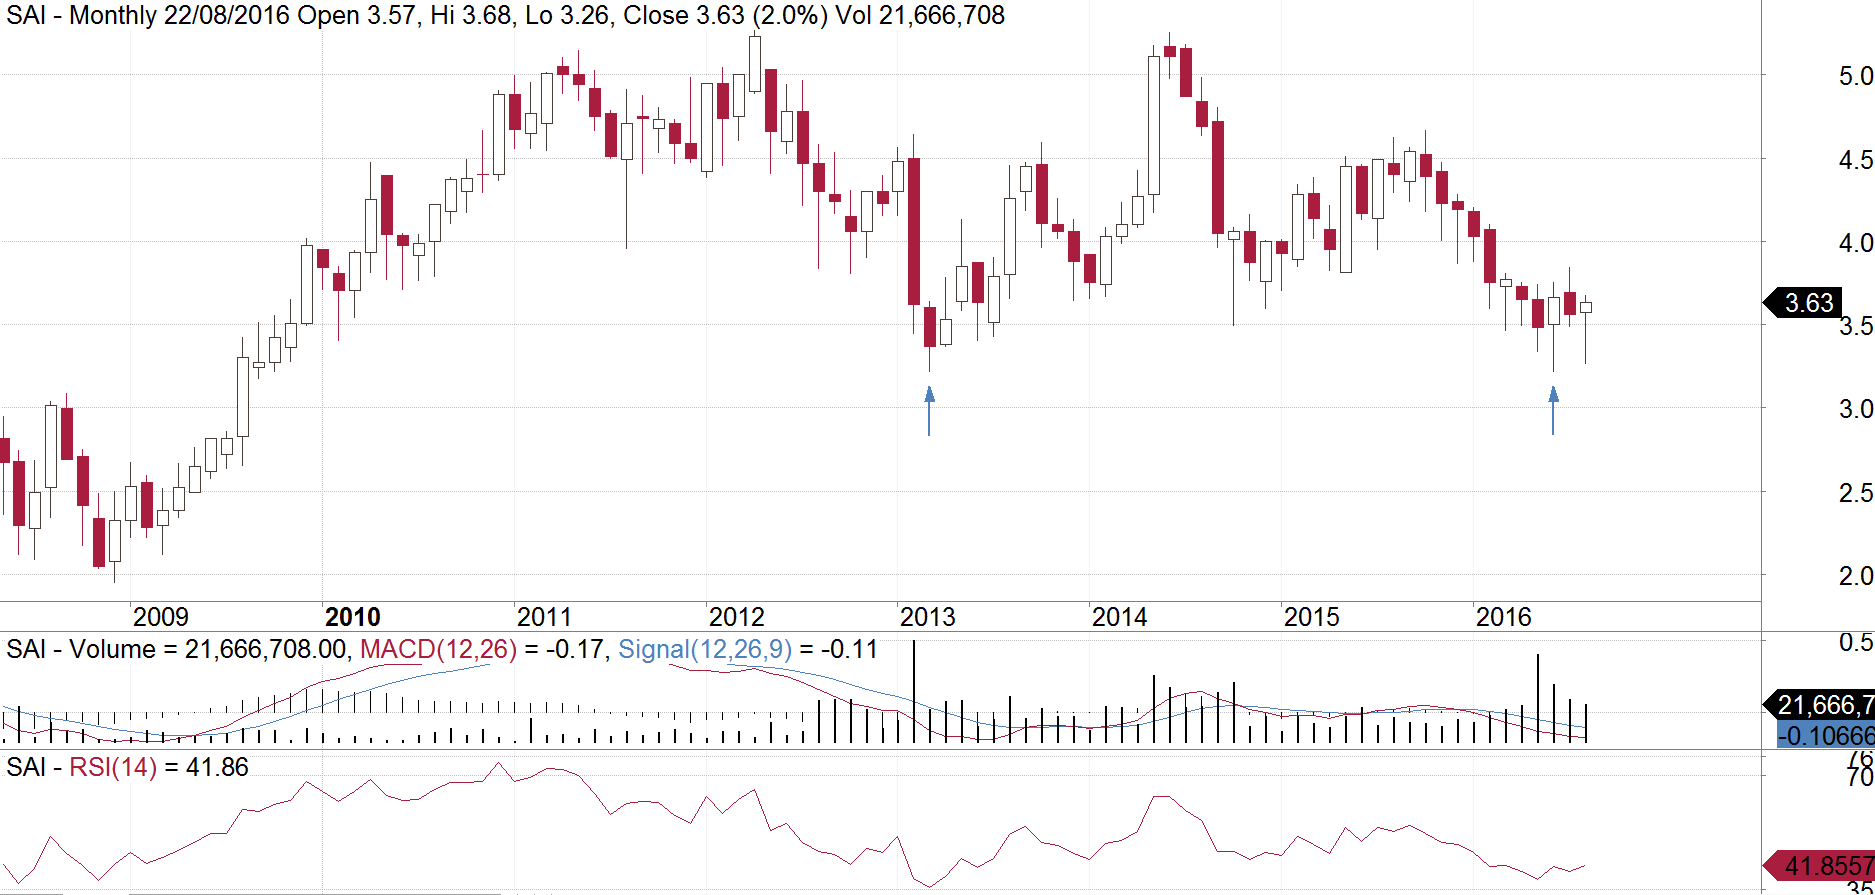
SAI seems to have formed a double low here on this monthly. Not only that, but this level represents a 61.8% retracement of the 2008 – 2012 rally. It went down to $3.215 in 2013 and then did the same again in June this year before bouncing. We have also noticed that the low point in the RSI was during 2013. This is significant because the RSI has therefore been trending higher for a few years now. This divergence is a positive sign. We also have seen some very good volume go through the stock over the past few months which could also indicate some accumulation now at these prices. It looks like a good low is in place and the stock should head higher from here. We have resistance levels around $3.90 and again near $4.50.
Our full research into SAI was sent out on 16 August 2016 to subscribers and clients.
Make sure you bookmark our main blog page and come back regularly to check out the other articles and videos. You can also sign up for 8 weeks of our client research for free!
Disclaimer: The information in this article is general advice only. Read our full disclaimer HERE.