

The average true range (ATR) measures the market volatility. This indicator shows how much a stock moves in a period. A high ATR can indicate a stock with a high level of volatility and a low ATR indicates a stock with a low level of volatility. The ATR can demonstrate how much an asset moves over the course of the day. This technical tool is commonly used with traders to place trailing stop losses.
To calculate the ATR you need to obtain the true range first. A true range is used rather than range (high price subtracted by low) as it captures price gaps when the market may open a lot higher or lower than the previous close.
A true range is the highest absolute number of the following 3. An absolute number is used so it doesn’t matter if the figure is positive or negative.
1.Today’s high less today’s low
2.Today’s high less yesterday’s close
3.Today’s low minus yesterday’s close
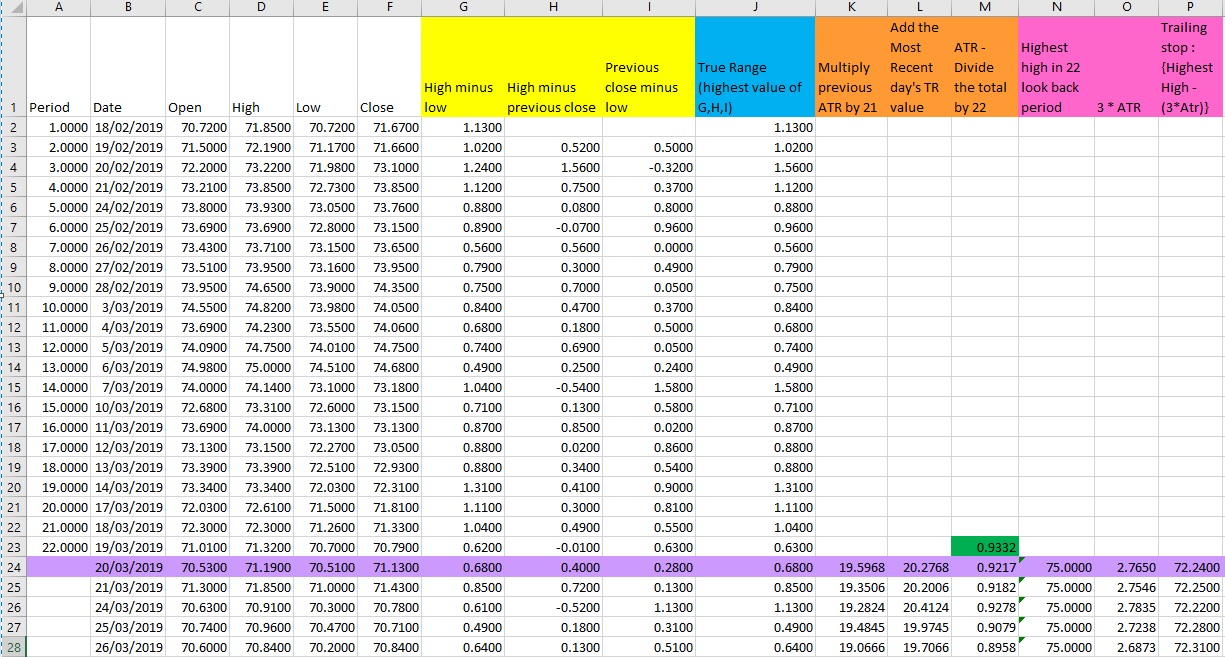
As per the spreadsheet below, we have used CBA as an example and columns G ,H, I (column highlighted in yellow) reflect these three numbers.
We use the highest absolute number of all these three which is in column called “true range” (column highlighted in yellow below).
In this example we use the 22 days as the time period. You can change this period to what you prefer. Hence we are measuring the average volatility for the last 22 days.
Stock :CBA

After we have the data for true range (TR) we use the figures to calculate the Average True Range.
Calculating Average True Range (see table below)
We can then calculate the average of these true ranges between a specific period. You can chose the time period you want to calculate. The most common time period is 14 days but in the example below we are using 22 days.
To calculate the average true range, we use the below formula
ATR= Previous ATR * (n-1) + Current TR/ N
ATR = {(Prior ATR *21) + Current TR} / 22
ATR= average true range
N= number of periods (we are using 22 days)
TR= True Range
Steps: (Orange columns K,L,M)
1.Take the previous 22 days ATR by 21
2.Add the current day TR value
3.Divide the total by 22
The first ATR is 0.9332 (highlighted in green) is the just the average of first 22 days true ranges as we don’t have calculation for the first ATR yet. A simple average was use for the first ATR.
Then we can calculate the ATR using the above formula.
In the line highlighted in purple- date 20/3/2019
1.We take the previous ATR of 0.9332 and multiply by 21 =19.5968 (column K)
2.In the next column we take the 19.5968 and we add the current true range (0.68) which is 20.2768 (column L)
3.Then we take 20.2728 and we divide it by 22 which gives us 0.9215 which shows the average true range (column M).
How to use ATR when putting trailing stops
We can use the ATR for trailing stop by using the Chandelier exit method. This uses an input period of 22 and a multiple of 3 times the Average True Range.
The trailing stop is calculated by using the below formula:
Chandelier Exit = Value of the highest high of the 22 look back period – ATR * 3
We are using 22 days as the look back period to obtain the highest high but you change this to whatever look back period you prefer (the Chandelier exit typically uses the 22 look back period).
In the column N in the pink, we have the highest high of the 22 day period, in column O we have (3*ATR) and column P shows the trailing stop.
For the date of 20/3/2019 (highlighted in purple) we have a trailing stop of:
Highest High of 22 days look back period – (ATR*3) = trailing stop
$75 – (0.9215*3) = $72.24
Hence a trailing stop of $72.24 indicates that if CBA falls past this level, it could be time to exit the trade.
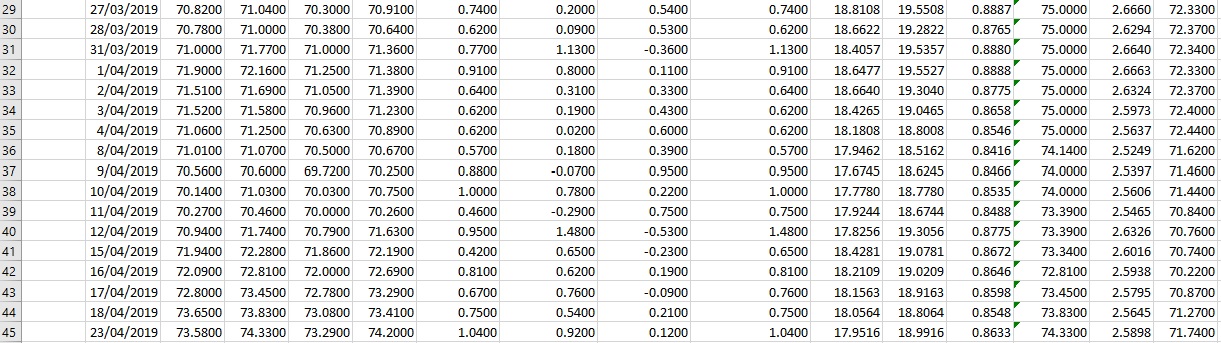
If we use this formula for each day we have a running trailing stop for each day as shown on column P.
Lauren Hua is a private client adviser at Fairmont Equities.
An 8-week FREE TRIAL to The Dynamic Investor can be found HERE.
Would you like us to call you when we have a great idea? Check out our services.
Disclaimer: The information in this article is general advice only. Read our full disclaimer HERE.
Like this article? Share it now on Facebook and Twitter!