
We have had a view for the last few months that you don’t want to be overweight the banks. But we’ve also had a view that at some point in January/February they could represent a buying opportunity – at least for the medium term. Here we share our views on the charts for each of the big 4 banks and where we think these buying opportunities will occur.
If you are interested in these and other opportunities, be sure to sign up to our free weekly newsletter where we will deliver them straight to your inbox.
ANZ
In the last few days it appears as though ANZ has broken down from a triangular consolidation. This means that it should resume the downwards move that started in October. We have an initial target of somewhere near $27.50 as it retests the June low. If it falls through there, then we have strong support closer to $26. But investors should be looking for support near $27.50 as the next buying opportunity.

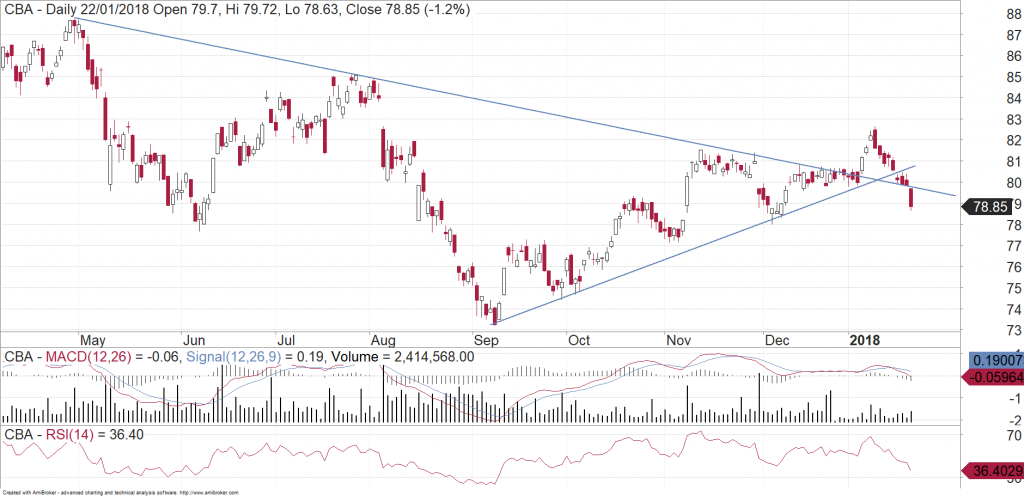
CBA
CBA has broken a couple of obvious support lines here but is now sitting at another key support level. To be positive on CBA, we need to see it quickly recover here and get back above $80. If not, then we could see it drift back towards $77 which is the next support level down.
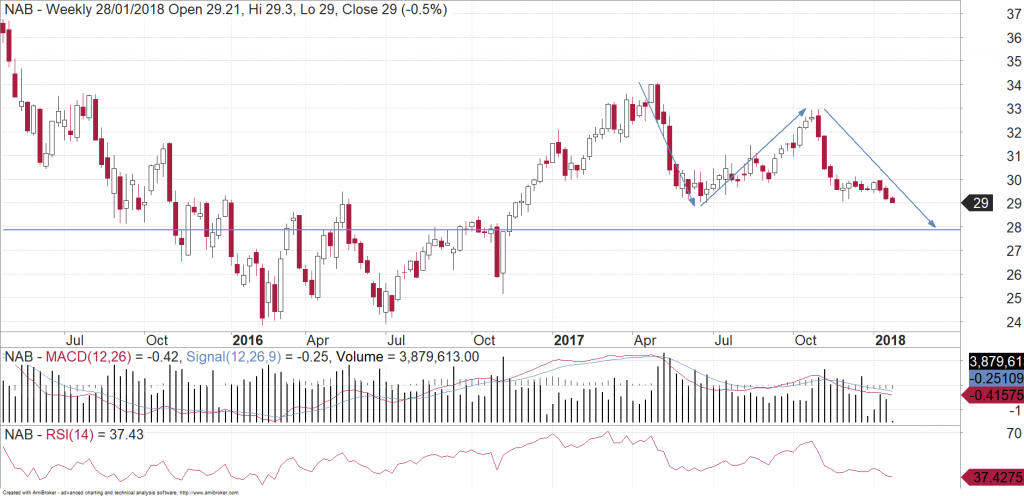
NAB
We highlighted the NAB chart back in September as an example of a stock struggling to go higher on lower volumes. Since then we can see that the shares have been belted down with volume increasing on the way down. They have come back to test the June low (which also happens to be the 50% retracement of the rally seen from the lows in 2016 to the peak in 2017). However, price action for NAB is particularly negative so at the moment it looks unlikely that it will bounce much from here. We therefore may see the stock extend its move down towards the 61.8% retracement level of $28. Coincidentally, that would also give us a neat “abc” pullback from the 2017 peak where wave “a” will equal wave “c”.
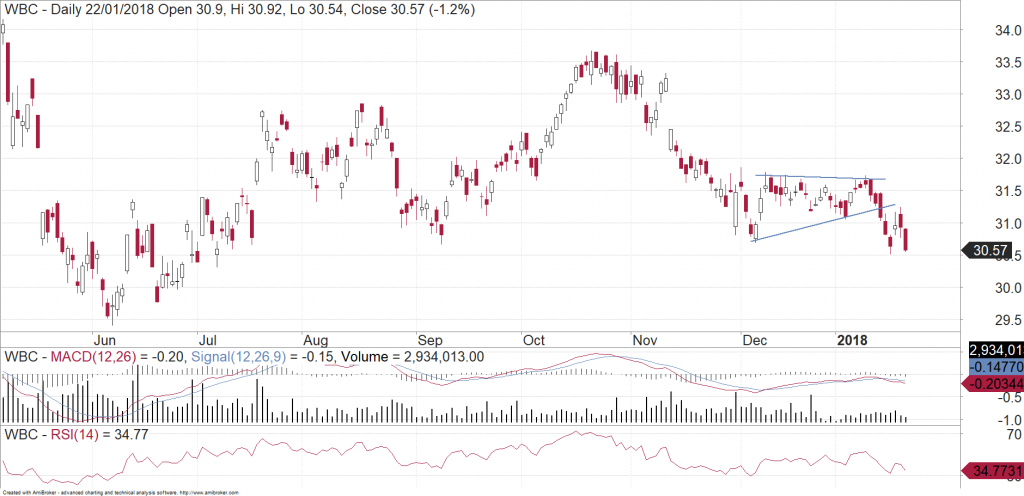
WBC
WBC is similar to ANZ in that it has recently broken down from a triangular consolidation pattern. It looks likely to come back and retest the June low near $29.50. Further support is close by at around the $29 mark.
Michael Gable is managing director of Fairmont Equities.
Sign up to our newsletter. It comes out every week and its free!
Disclaimer: The information in this article is general advice only. Read our full disclaimer HERE.