

This post formed the basis of an article which then appeared in the Australian Financial Review on 1 March 2017. Michael Gable is a regular expert contributor to the AFR. You can access the AFR version HERE.
LendLease ended 2016 at about the same levels as where it started. The charts however show that it was in the red for much of the calendar year. One of the major concerns that the market had was with settlement risk. There was a fear that apartment defaults would be a problem. Monday’s half yearly results alleviated much of these concerns with LendLease demonstrating less than 1 per cent of apartment defaults. We continue to see a strong pipeline of projects and the company has shown earnings and cash flows to be quite strong. The share price duly jumped up with an initial re-rating by the market, but could it have further to go?
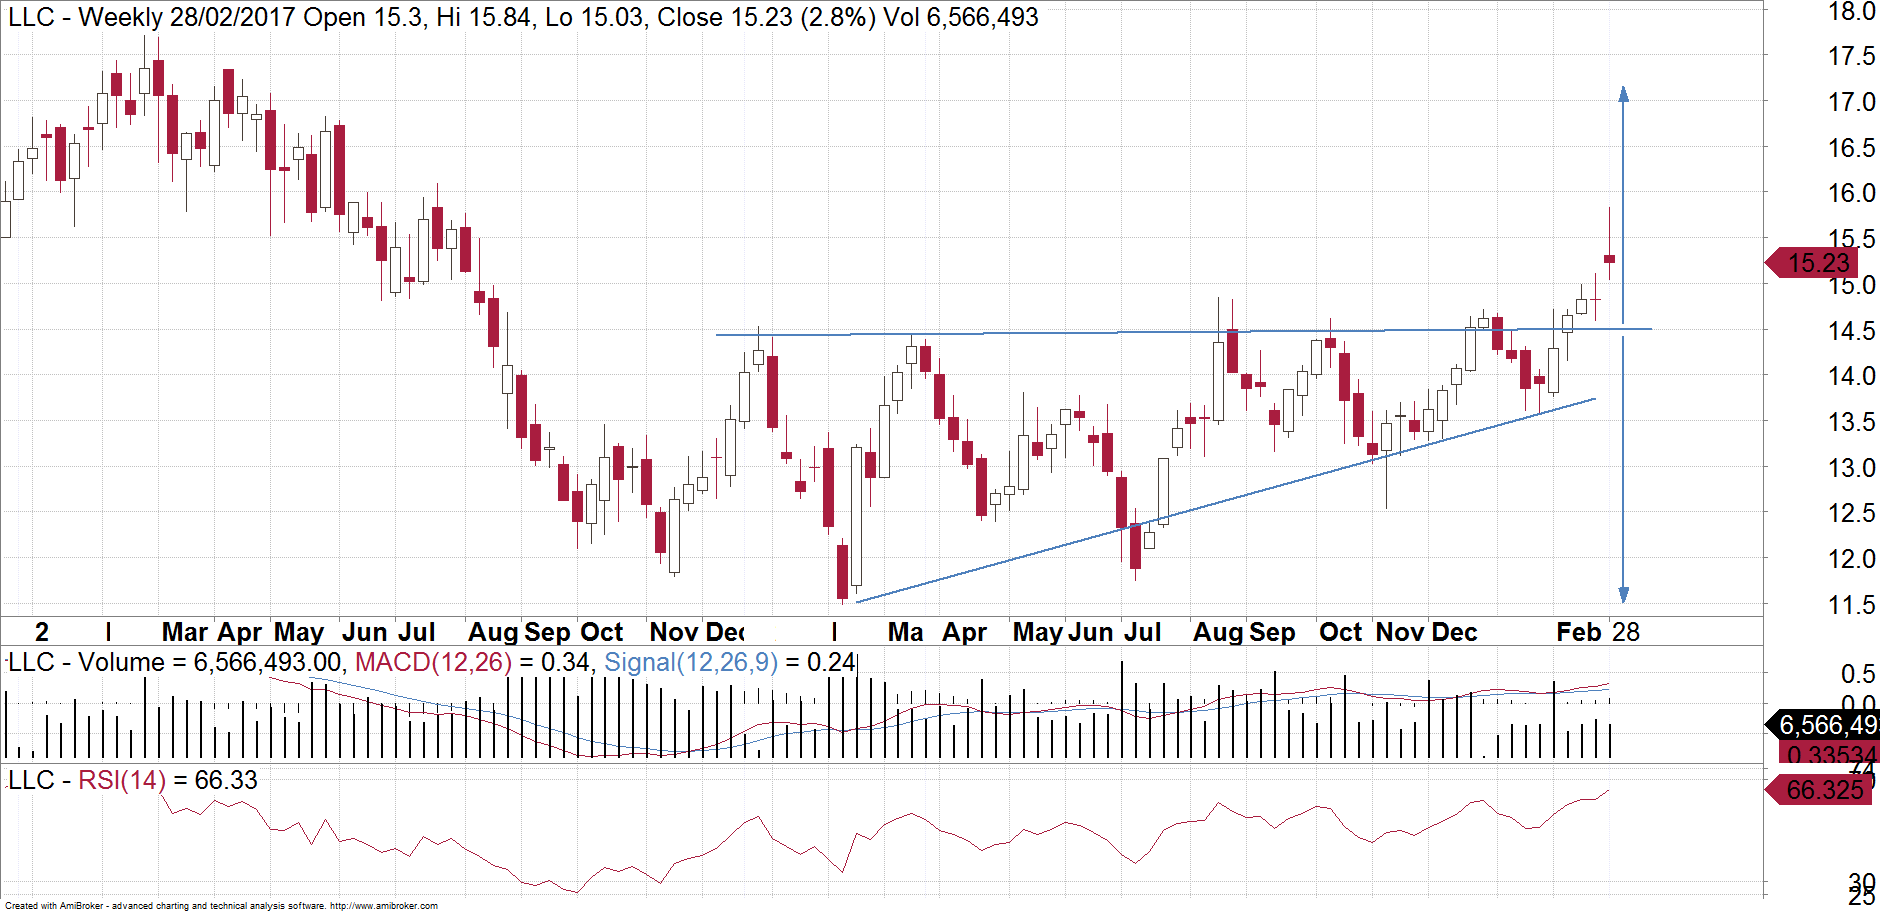
We looked at the LendLease chart in March last year and could see some resistance near $15 that needed to be breached. It has taken the stock nearly a year but we have finally seen this key level get broken. One would be right in assuming that the extra time taken for this breakout is actually a positive sign. During the last year, LendLease has been making “higher lows”. This can be seen on the chart with the diagonal line. This indicates buying of the dips, with each dip not being able to get as low as the prior one. This resistance level just under $15 has had a few attempts of being broken. The fact that it has dragged on for a year only makes this level even more significant as the tension builds. With a break above this resistance line now finally occurring, there is more chance that it will draw in the buyers. If LendLease can hold above this resistance line, then it should now start to trade in a new range. The size of this range should be equal to that seen in 2016 (shown with the arrows), which implies an upside target this year of over $17.
Make sure you bookmark our main blog page and come back regularly to check out the other articles and videos. You can also sign up for 8 weeks of our client research for free! Otherwise you can email Michael Gable directly at michael@fairmontequities.com
Uniquely combining both Fundamental and Technical Analysis
Not yet a subscriber? Join now for FREE!
Receive our weekly tips and strategies into your inbox each week.
BONUS: Sign up now to download our 21 page Trading Guide.
Disclaimer: The information in this article is general advice only. Read our full disclaimer HERE.