This post formed the basis of an article which then appeared in the Australian Financial Review on 7 December 2016. Michael Gable is a regular expert contributor to the AFR. You can access the AFR version HERE.
The Australian market has recently been edging higher but much of that is due to earnings upgrades in the commodities space. The sector has done it real tough in the last few years but this year we have seen some of these stocks provide some great performances. With the rest of the market performing poorly in comparison, investors are unsure whether there is enough upside left in the commodities space to make a switch. One of the great performers of this year has been BlueScope Steel. Although iron ore, a key input, has seen significant price rises, steel prices have almost managed to keep pace. Cost reductions and productivity gains have also helped BlueScope Steel’s earnings improve remarkably. The market has reacted favourably to these changes and buying interest has swept back into the stock. A Trump victory in last month’s US election has only further fuelled GDP growth expectations – which in turn flows through to an interest in steel stocks.

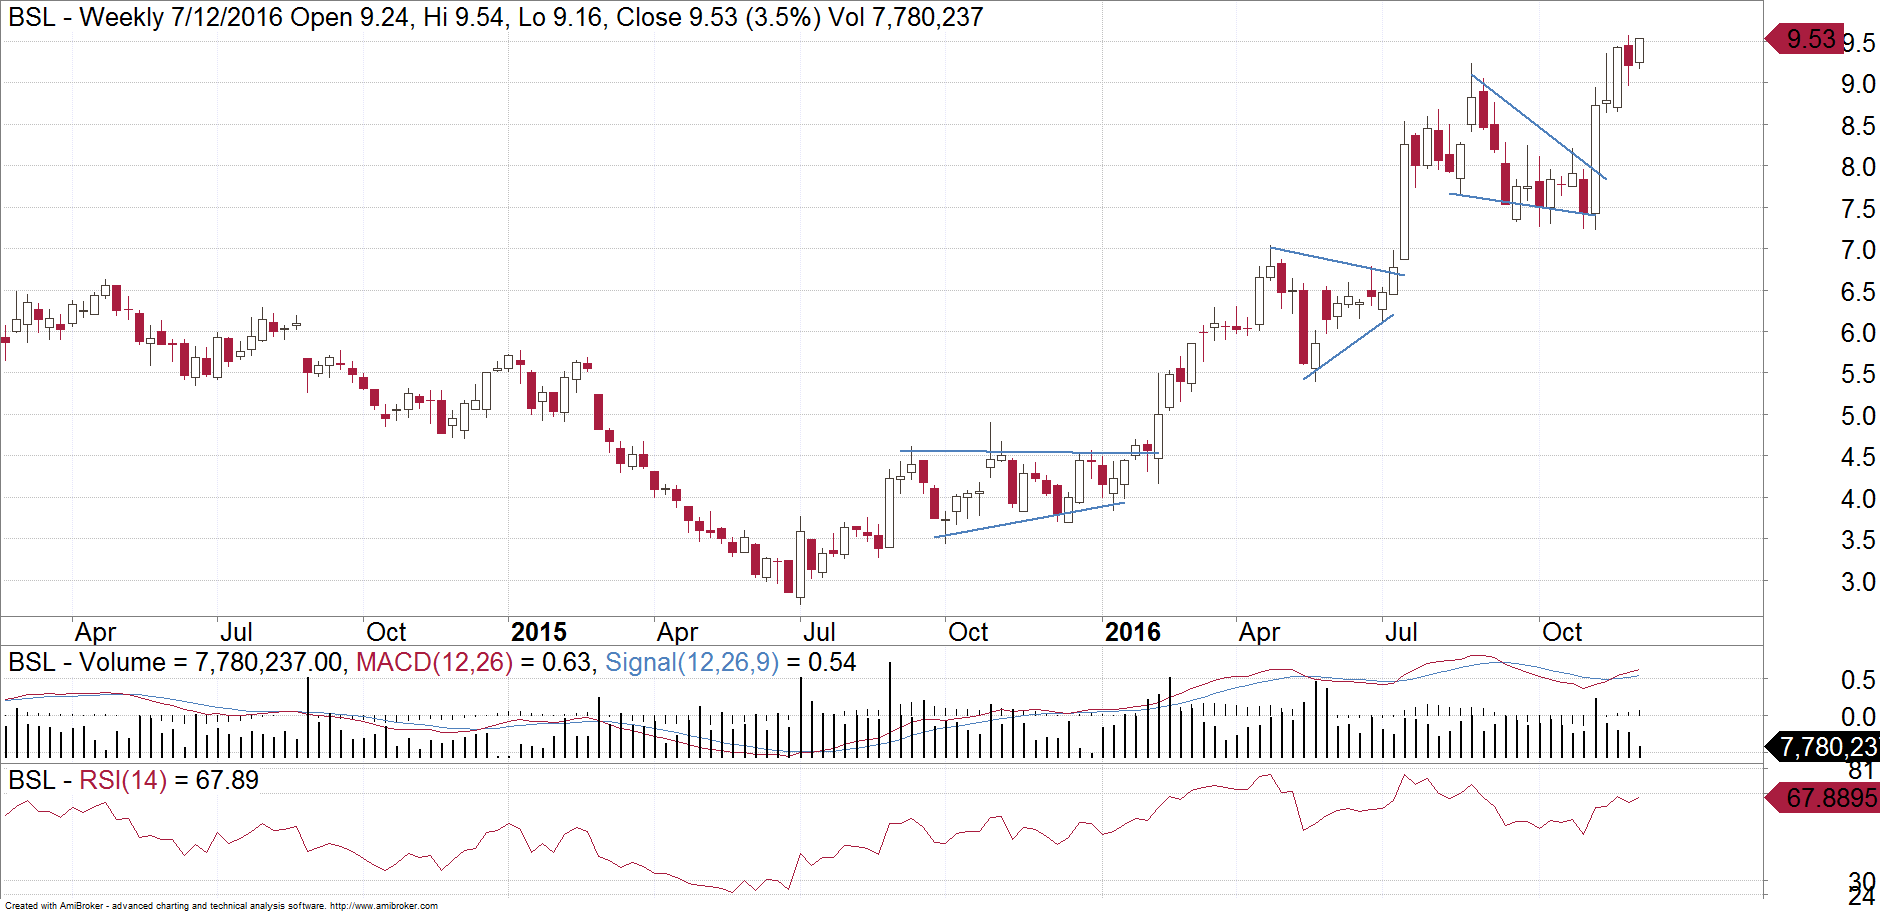
After starting the year near $4, the share price has now doubled to over $9. Whilst many feel that stocks in this sector are looking a bit stretched in the short term, we see the opposite with BlueScope Steel. When we look at how this uptrend has been developing throughout the year, it provides us confidence that it is still sustainable for a while yet. One the simplest ways to determine the sustainability of a trend is to look at the gradient of the chart. When a stock is moving higher, investors get nervous when it seems to climb very quickly. A movement up that is almost vertical makes investors worried that a stock has run ahead of itself. A sharp movement up is a sign of strength, but it is important that a stock then takes a breather. After a sharp run up, if a share price can then ease off slightly instead of being sold down heavily, then this is viewed as a healthy consolidation. The market uses this time to digest the recent rally, and prepares for the next move up. We can see this happening quite neatly with BlueScope Steel since it rallied off the lows in 2015. A sign of strength is if these consolidations sit on top of each other instead of overlapping. On our chart, we can see the upper and lower part of each consolation marked out with the blue lines. It is also obvious that they are sitting on top of each other, like a set of stairs climbing higher and higher. At the moment we do not see any warning signs that this trend in BlueScope is about to end. At this rate, I expect the stock to rally towards $12 before finding some resistance and undergo another period of consolidation.
Make sure you bookmark our main blog page and come back regularly to check out the other articles and videos. You can also sign up for 8 weeks of our client research for free!
Uniquely combining both Fundamental and Technical Analysis
Not yet a subscriber? Join now for FREE!
Receive our weekly tips and strategies into your inbox each week.
BONUS: Sign up now to download our 21 page Trading Guide.
You can contact Michael Gable directly on michael@fairmontequities.com
Disclaimer: The information in this article is general advice only. Read our full disclaimer HERE.

