

Moving averages are a common tool used by technical analysts to identify the trend of a stock price or index. Two common examples which are used is the simple moving average and the exponential moving average. The simple moving average uses all the data points in equal weight. However, the exponential moving average focuses more weight on the recent price. Moving averages can be used for the period the investor wants to analyse. Most commonly used is the 50 or 200 day moving average. Traders though can set up the moving average to whatever period they like.
What does the exponential moving average identify?
Traders can use the exponential moving average to determine if a stock is in an uptrend or downtrend. When the stock is trading below the EMA it can indicate that the stock is trending lower. If the stock is trading above the EMA line then it can indicate that the stock is trending higher.
The EMA line can also indicate support and resistant lines. Support lines may indicate how far the stock will fall. Resistance lines can indicate how far the stocks will reach.
Example:
If we look at the below stock, Booktopia Group (ASX:BKG) the chart shows the stock has for most of the past year been trading under the 50-day exponential moving average line which showing a downwards trend.
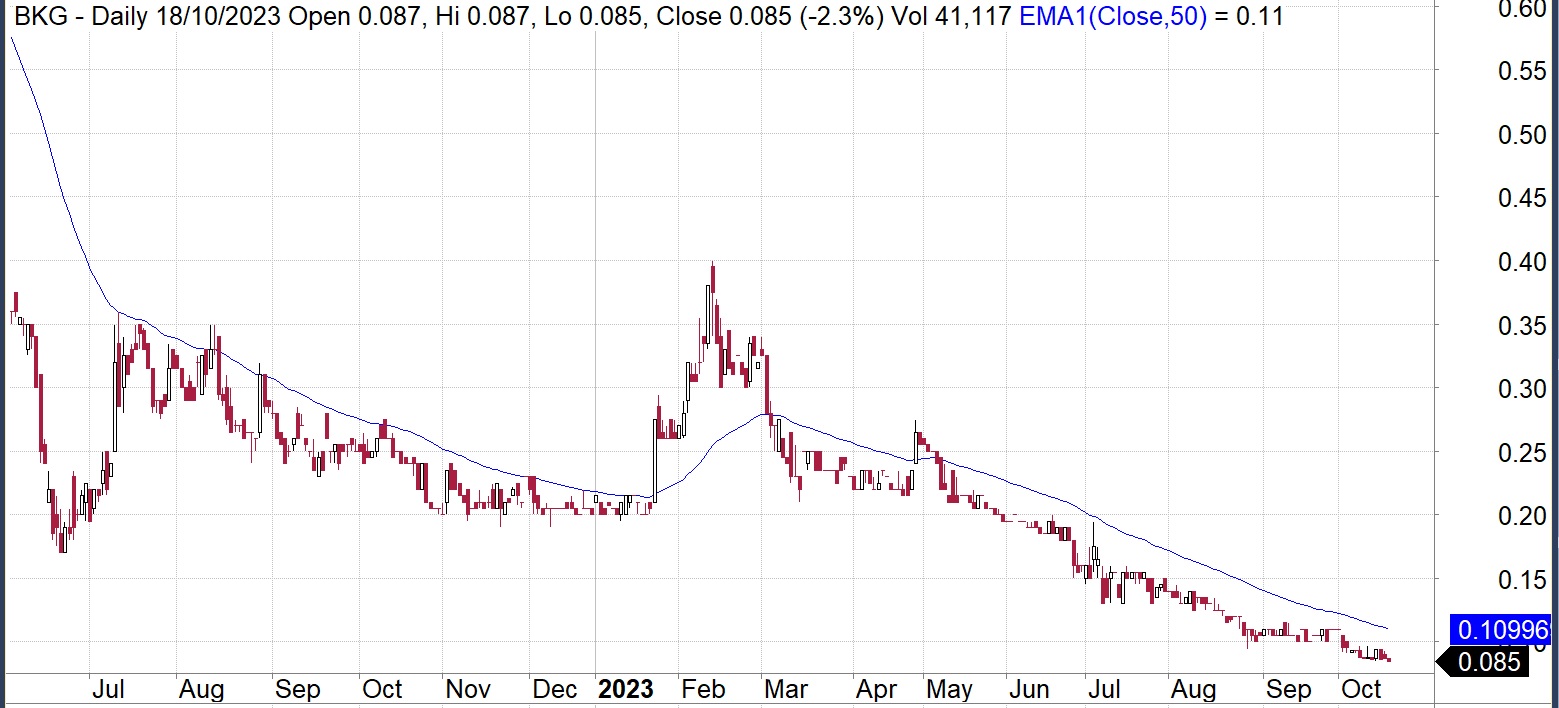
Source:Amibroker
How to use the moving average
- The moving average crossover
There is a term called the golden cross which occurs when the short term simple moving average the 50-day moving average crosses above the long term 200-day simple moving average. Technical traders would use this as a buy signal.
If the short term simple moving average, 50-day moving average crosses below the long-term moving average 200-day moving average then this is a death cross and would be considered a sell signal.
However, a trader can select any set of moving averages that best fit the particular stock being traded and use a crossover as a buy or sell signal.
- Price trading above/below the moving average
The other technique is to find a moving average that fits the stock and your trading profile. When the share price rises above the moving average, then you have a buy signal. When it trades below the moving average, then you have a sell signal.
Disadvantages of the moving average
Traders need to be aware that the moving average is based on historical data. When prices tend to trades sideways and become choppy, then a number of buy or sell signals could trigger. This means that a moving average is not the best indicator to use in this type of market. They are therefore more effective in trending markets.
Lauren Hua is a private client adviser at Fairmont Equities.
An 8-week FREE TRIAL to The Dynamic Investor can be found HERE.
Would you like us to call you when we have a great idea? Check out our services.
Disclaimer: The information in this article is general advice only. Read our full disclaimer HERE.
Like this article? Share it now on Facebook and Twitter!