There have been numerous headwinds for share markets over the past 18 months. However, at some point we move past the worst of it and markets start to recover. Bear markets always lead to bull markets. What we have noticed over the years though, is that bearish sentiment persists well past the share market lows. It takes time for investors and media commentators to realise when the investing environment is looking much better. By then, the market has already moved substantially higher, led by the “smart money”. Uptrends start by climbing a wall of worry and end when everyone is on board.
As Sir John Templeton, famously said, "Bull markets are born on pessimism, grown on scepticism, mature on optimism, and die on euphoria."
Is this market rally the birth of a new bull market? Are markets now climbing a wall of worry?
At last count, the list of things to worry about in 2023 have been:
- Higher interest rates. But now they seem to have peaked. Whether there is one more rate hike coming or not, the great uncertainty over rate hikes from 2022 is now over.
- The banking crisis. That didn't evolve into a run on the banks or a mass banking collapse, and the financial sector has the strength to continue on.
- A plunge in corporate earnings which would send the market into a tailspin. Earnings in the US have actually beat expectations recently.
So far we have ticked these off our list of concerns to worry about.
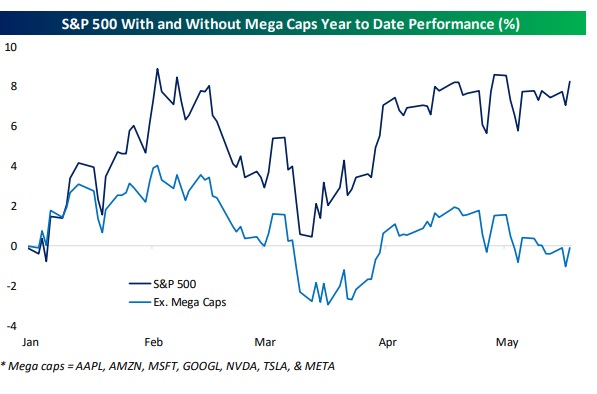
What are the latest issues concerning market commentators? Much is being made now of how the US markets are being led higher by only a handful of stocks.
Those who are concerned that stocks are still too expensive only need to remove these few big tech names from the S&P 500 index and they will have an index that hasn't moved since the start of the year. In other words, they have an index that is, dare we say, cheaper. So the "market breadth is bad" brigade have just countered the argument that stocks are expensive. Take out the big tech stocks and we can see that the vast majority of the market trades at a reasonable level.

Chart courtesy of Bespoke Investment Group
What would happen if these downtrodden stocks start to move higher again finally and market breadth improves? An uptrend is more reliable if market breadth is higher, but that doesn't mean that market breadth cannot improve from here as the macro data continues to come in looking positive and company earnings show that they are holding up better than expected. If the laggards start to move higher, then share markets would have further to go.
The other concern for market participants is the debt ceiling in the US. Once this gets resolved, then what would be the next problem concerning the market commentators? At some point you need to pay attention to the money flow. And the money flow is showing that stocks are being slowly bought up and that there is further to go.
We continue to be open minded that stocks can climb a wall of worry, just like in the middle of 2020. Remember, almost everyone seems to be calling for a recession and lower levels in stocks. If you had this view, you would be in cash. However, what happens if at some point it becomes clear that markets are not going to new lows and that the lows from 2022 at the height of uncertainty was as bad as it was going to get? That money would need to get moving because markets would be moving higher and term deposits won't look very attractive later this year as rates start dropping again. Just like the end of 2020 when the "market is going to retest the lows" group had to face reality that the global pandemic wasn't going to wipe out the human race. That only gave the market another big leg higher. We cannot exactly predict the future, but it is important to be open minded about this possibility and not be left scrambling later this year to chase stocks that have already moved substantially higher.
Let’s look at the debt ceiling issue. No-one knows how it will be resolved, but the most probable outcome is that it gets resolved and we move on to the next thing to worry about. If we get a short-term negative outcome, then I think any market reaction would also be quite short-term. Remember, there are still plenty of those in cash looking for a recession to take things lower. And as time passes, they will get more and more nervous that things aren't going to be that bad. So as they realise that this market may not be going back to its lows, then they will use any sell-off as a chance to grab some stocks because they may not get another chance. The point is, we don't think the current debt ceiling issue is one that will have more than a short-term effect on stock prices and any dips will be used a buying opportunity.
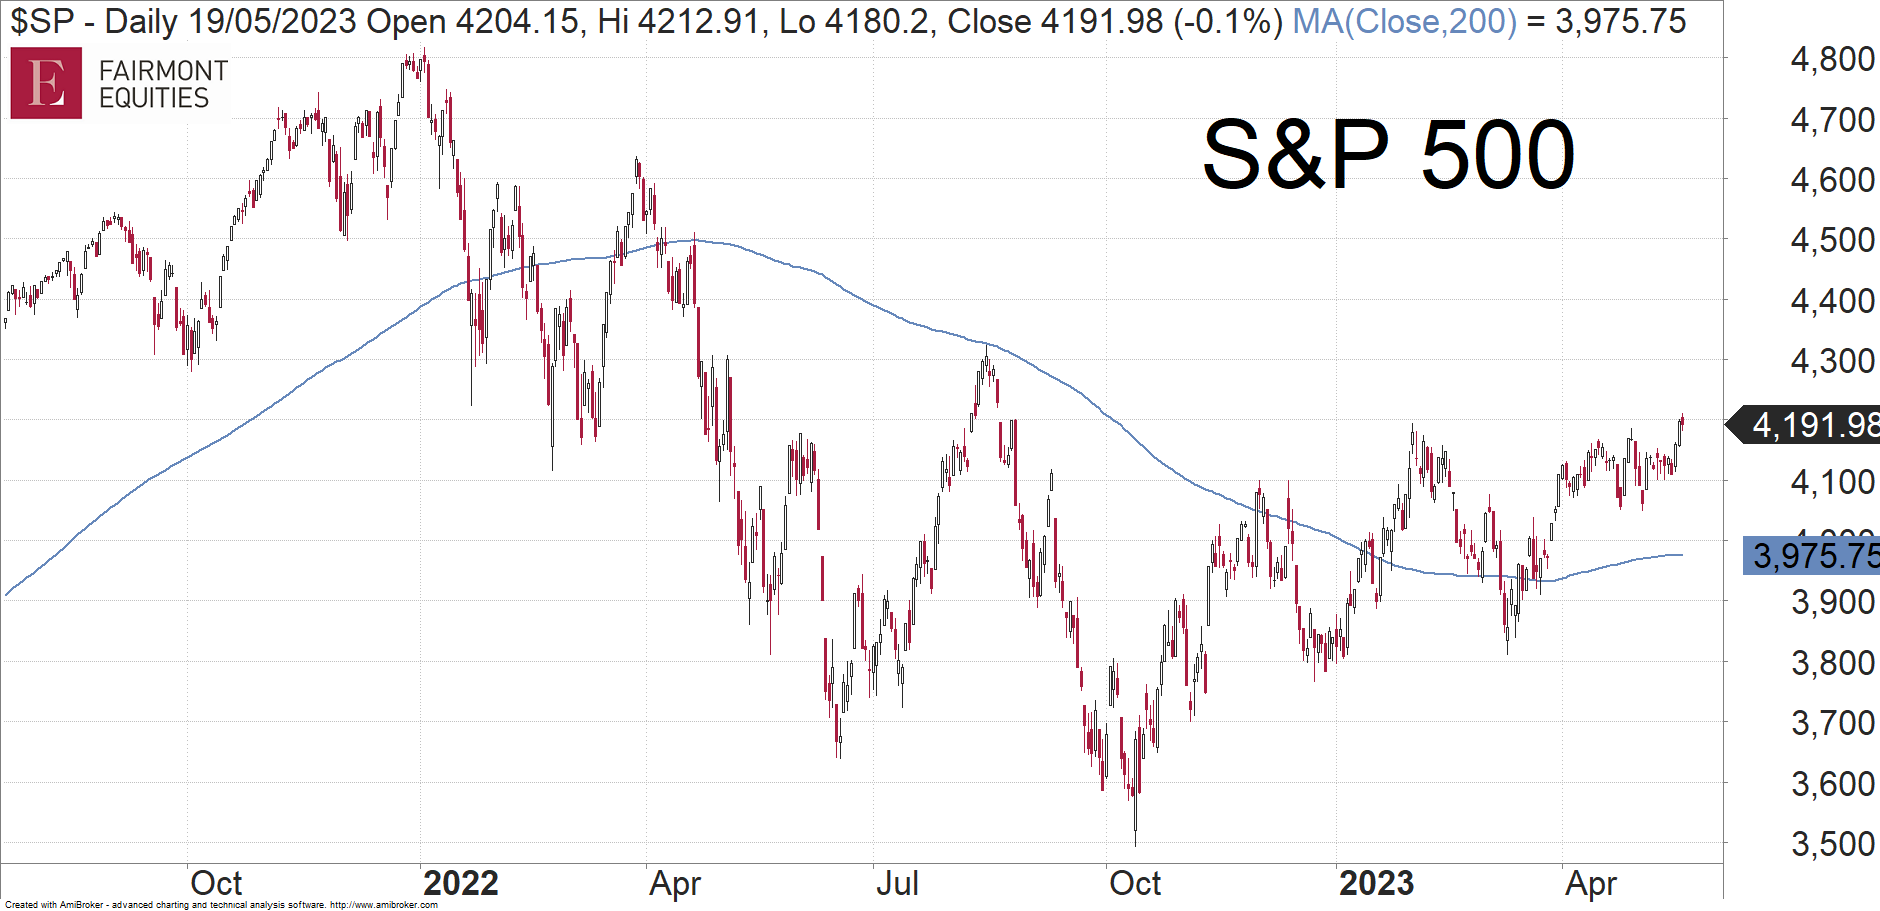
This is what the charts are telling us. That is, what does the flow of money tell us:

We have seen the S&P 500 recently consolidate under the February high, only to break higher. It continues to trade above the 200 day moving average which is a positive sign. Judging by the way the S&P 500 is trading right now, it doesn’t look like it wants to make a new low.

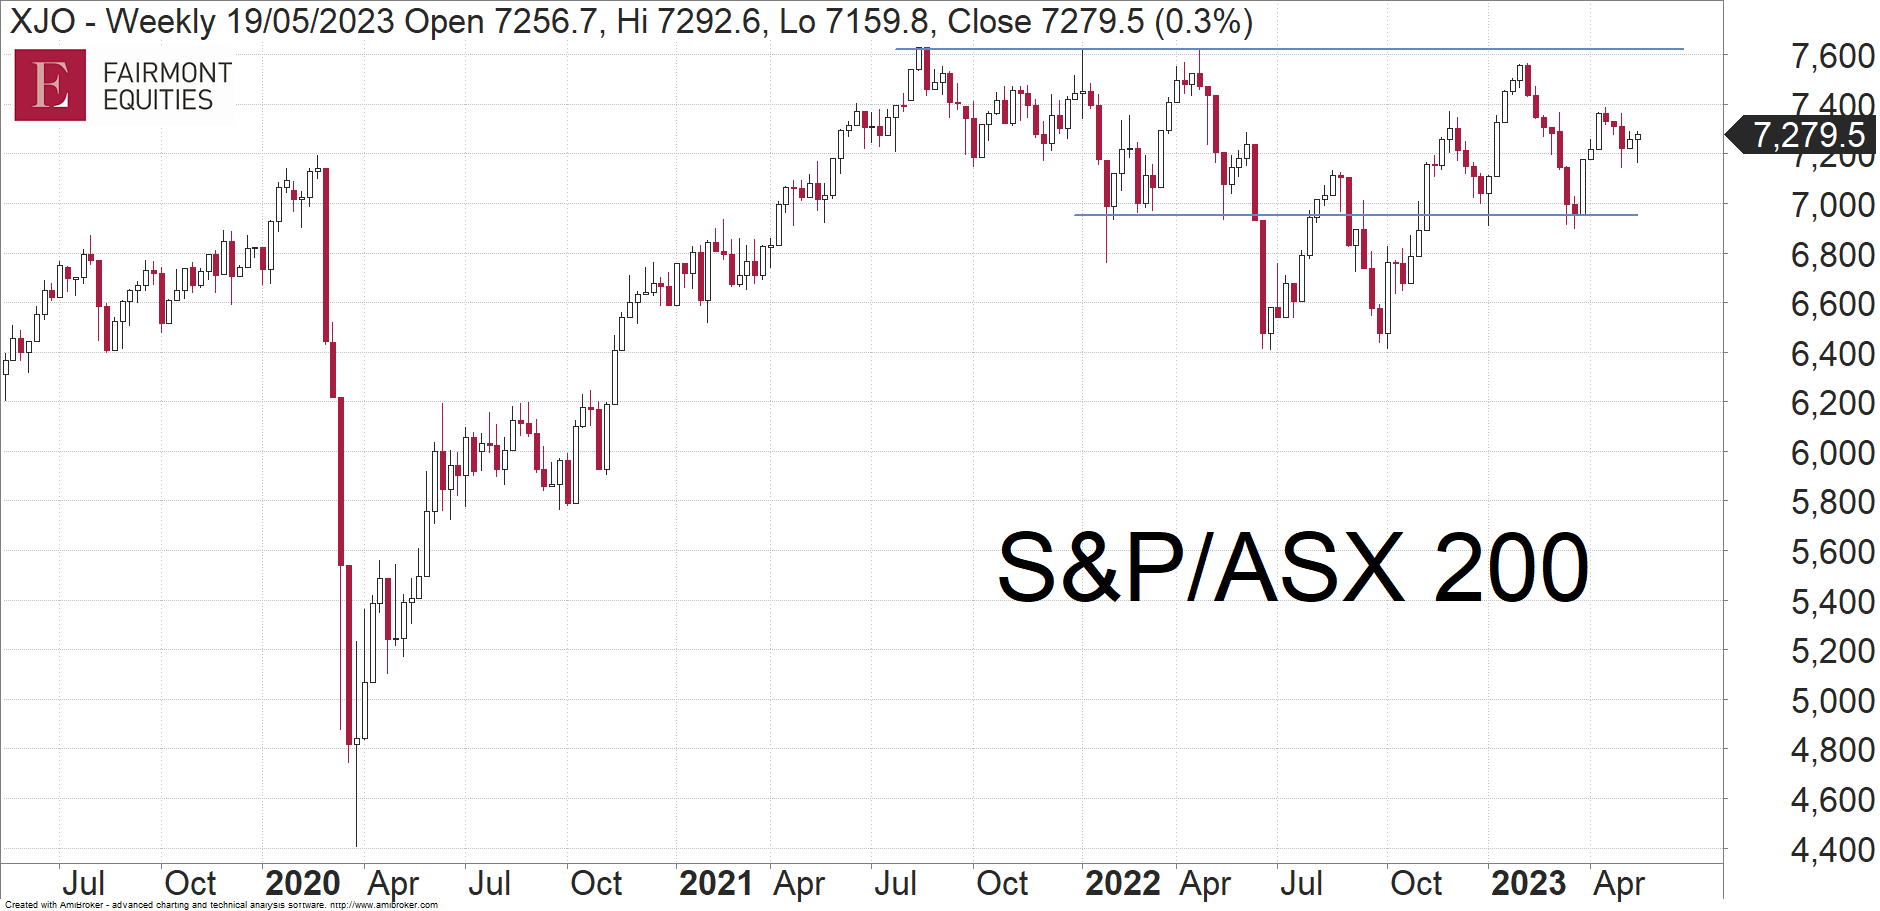
The Australian market on a weekly chart looks very bullish. It has spent most of the past 18 months up at these levels. It has tested its all time highs near 7600 on multiple occasions. The mistake that some investors make is that they believe that the more you test a level, the stronger it is. In fact, the opposite is true. The more you test a level, the more you weaken it. The Australian market has shown strength in the face of adversity. This is a positive. If our market can retest that 7600 area one more time, then there is a high chance that it will break to a new high. It won’t make sense to the general public and the journalists, just as markets rallying in 2020 didn’t make sense. But the newsflow will start to justify it over time and the cash on the sidelines will need to step in, providing more fuel to the rally. The Australian market is therefore one that investors need to have exposure to.
At the end of the day, scenarios like this are not far-fetched. Investors need to be open minded to these possibilities. Almost everyone is bearish at the moment. But when everyone is on one side of the boat, it pays to move to the other side. Sitting with the consensus view will not provide you with the opportunities to make money, especially when that view is already very crowded.
Follow our advice for the next 8 weeks for FREE
As a bonus, we will send you our 20 page guide on how to buy and sell.
Sign up now to receive:

"Michael’s analysis is concise and easy to understand for any level of investor. I’ve gained more from his free content alone than many other paid services I’ve tried. Highly recommend for anyone seeking to gain an understanding of technical analysis and how to read a chart." Leigh McLaughlan, Redcliffe QLD
"Michael's ability for technical analysis is exceptional and has easy to understand fundamentals in the reports." Diane Partridge, Walcha NSW
“The weekly reports are really good and useful. They offer a great deal of background information and educate us well” Michael Burnicle, Mudgee NSW
Michael's analysis has been featured in:

Thousands of investors have relied on our charting analysis since 2013.
Isn't it time for you to also add that extra edge to your investing?
Sign up now!
Receive:
- Our special trading guide on how to Buy and Sell Stocks
- 8 weeks of our research
Fairmont Equities Australia Pty Ltd (ACN 615 592 802) is the holder of an Australian Financial Services Licence (AFSL 494022) and is licensed to provide general advice.
The information contained in this report is general information only and is copywrite to Fairmont Equities. Fairmont Equities reserves all intellectual property rights. This report should not be interpreted as one that provides personal financial or investment advice. Any examples presented are for illustration purposes only. Past performance is not a reliable indicator of future performance.
No person, persons or organisation should invest monies or take action on the reliance of the material contained in this report, but instead should satisfy themselves independently (whether by expert advice or others) of the appropriateness of any such action. Fairmont Equities, its directors and/or officers accept no responsibility for the accuracy, completeness or timeliness of the information contained in the report.
* All share price charts are courtesy of AmiBroker
