

What are Bollinger Bands:
Bollinger bands were devised by a technical trader named John Bollinger.
They represent volatility indicators. We wrote about volatility in our previous article.
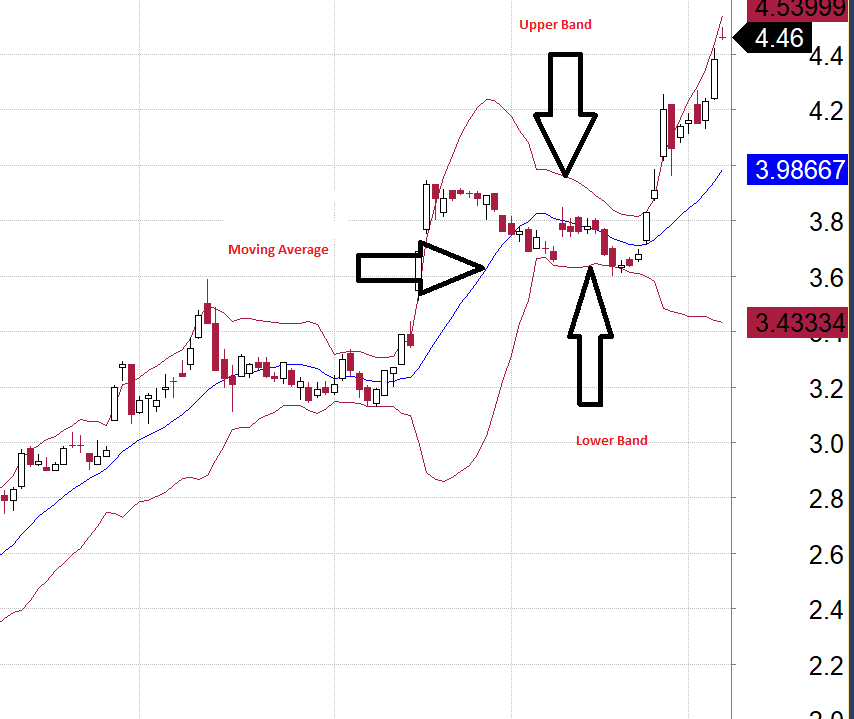
Bollinger bands consist of a moving average, an upper band and a lower band. The middle band represents the 20 period moving average. The upper band is two standard deviation of price plus the 20-day (Simple Moving Average) SMA. The lower band is the middle band minus two standard deviations of price. The standard deviation is a measure how the stock prices move in comparison to the average price of the stock.
Purpose of Bollinger Bands:
The purpose of Bollinger Bands is to show the range of price movement. Prices are considered to be high in the upper band and low at the lower band. This tool can also assist in determining overbought and oversold levels.
How to use Bollinger Bands:
When there is a large range between upper and middle bands, it means volatility is high. Narrow bands mean not a lot of movement in price.
The price of a stock usually trades in the middle of the bands, hence Bollinger bands can show support and resistance levels.
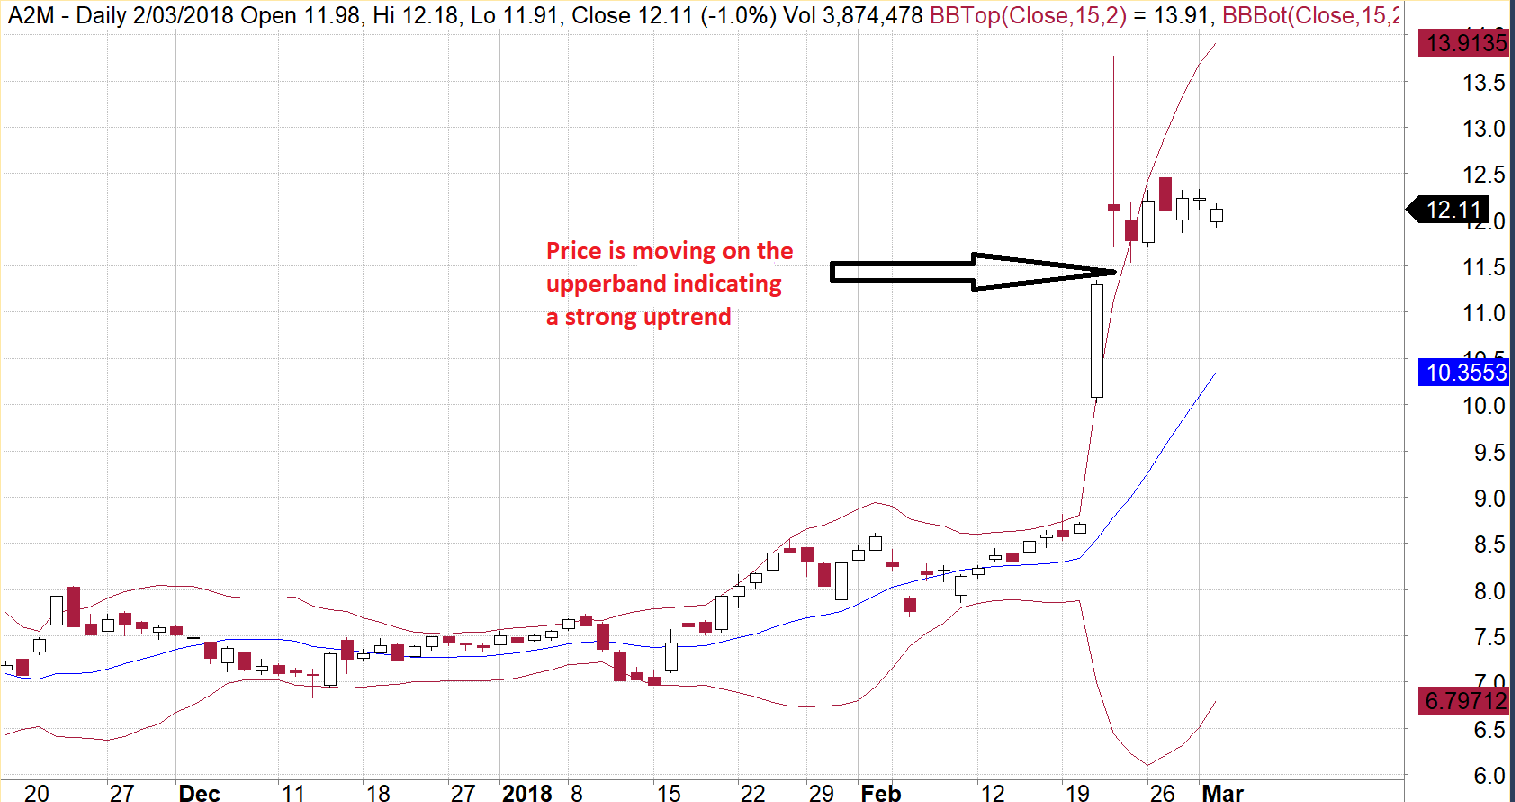
A strong uptrend can be ascertained when the stock trades within the upper band regularly. This shows price strength and strong buying activity. If the price of the stock drops but stays above the middle band and then moves back to the upper band, this indicates price strength. In the diagram below you can see A2 milk trading on the upper band. This shows strong buying action and therefore the stock continues upwards. If the price falls from the upper band and crosses below the 20-day moving average, this can represent a potential downtrend and therefore a lower price target.
A strong downtrend is represented when the stock price oscillates only within the lower band. This movement conveys strong selling activity. If the price jumps off the lower band and crosses above the middle line then the upper band, this can indicate a reversal of a downtrend.
If the upper band and lower band start to move closer together then this can become the Bollinger squeeze. The action can suggest a breakout. If the price starts to break out above the top band then the stock will usually continue to go up. If the price breaks down below the bottom band then the price will usually continue to go down. The diagram below of A2 milk shows where the bands narrow. It then touches the upper band and an uptrend commences.
Another strategy is to trade within the bands. When you find that a stock is stuck trading in a trading range, then buy the stock when it is trading in the lower band. When the stock goes up to the high of the range and is trading on the upper band then sell it.
The best way to use Bollinger bands is to use it in combination with the RSI indicator or MACD to determine overbought and oversold levels.
 Source: Amibroker
Lauren Hua is a private client adviser at Fairmont Equities.
Sign up to our newsletter. It comes out every week and its free! You can leave your email with us via the form on the right-hand side of this page.
Otherwise you can email us at mail@fairmontequities.com
Disclaimer: The information in this article is general advice only. Read our full disclaimer HERE.
Like this article? Share it now on Facebook and Twitter!