

The moving average convergence divergence (MACD) indicator is a popular tool used by traders to help with their entry and exit points. In certain circumstances, it can be extremely useful and reliable. You may have noticed it on many of the charts used by us here at Fairmont Equities.
Here is an explanation on what it is and how to use it.
How to Calculate the MACD.
The MACD is a momentum-based trading indicator. This indicator can show changes in the speed of price movement and traders use to determine the direction of a trend.
The MACD is calculated by subtracting the 26-period Exponential moving average (EMA) from the 12 period EMA. This line is then plotted and this line is the MACD line.
A 9 day EMA of the MACD is then plotted on top of the MACD line and this serves as the line which can show traders the direction of the trend of the stock.
The EMA is used as opposed to SMA (simple moving average) as the EMA incorporates recent price swings more.
Although a MACD can you be plotted using a charting package, it is worth understanding how the MACD is calculated manually.
The formula for the Exponential moving average is:
EMA = (today’s closing price *K) + (Previous EMA * (1 – K))
N = number of days in EMA
K (Smoothing Factor) = 2/(N+1)
a) The first step is to obtain the closing prices of the stock you want to analyse. In our example we are using A2M.
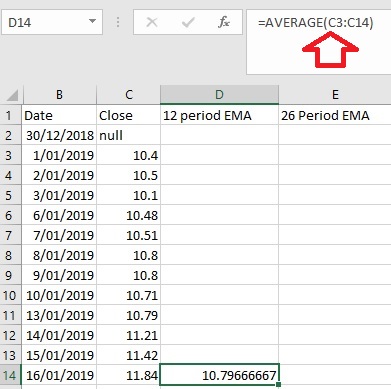
Let calculate the 12 period EMA using the formula above.
The first value will be the average of the closing prices of the first 12 closing prices:
b) Then for the next period you can use the above EMA formula to calculate the 12 period EMA:
Lets use an 17/1/2019 as an example of the calculation:
EMA = (today’s closing price *K) + (Previous EMA * (1 – K))
=11.75 * (2/(12+1) + (10.7967 * (1 – (2/(12+1))
= 10.94333333
Use the excel formula(screenshot below) and calculate this for all the dates

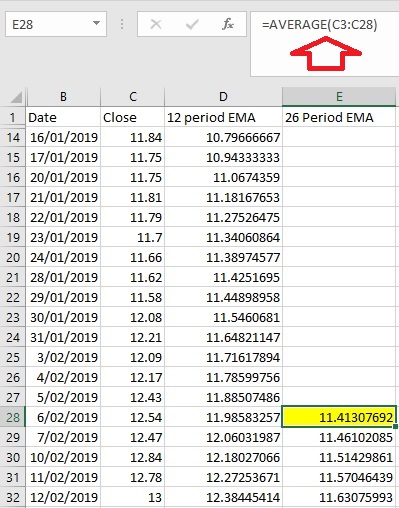
c) To obtain the 26 day period EMA we do the same thing but for the time period of 26 days.
The first value is the averages of the closing prices(see below screenshot) of the last 26 days and the same EMA formula is used to calculate the rest:
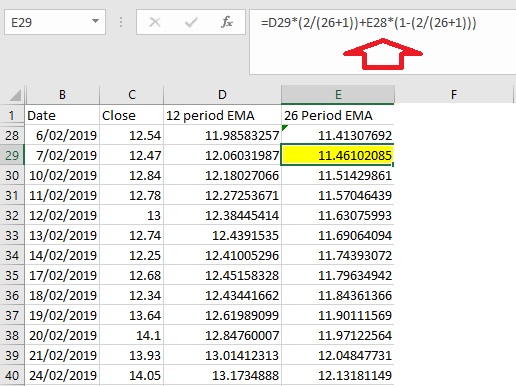
For the date 7/2/2019 we calculate the 26 period EMA as follows:
EMA = (today’s closing price *K) + (Previous EMA * (1 – K))
= K (Smoothing Factor) = 2/(N+1)
EMA = (12.47 *(2/26+1) + (11.41307692 * (1-(2/(26+1)))
= 11.46102085
Repeat this for all the dates under the column “26 day period EMA “using the below excel formula
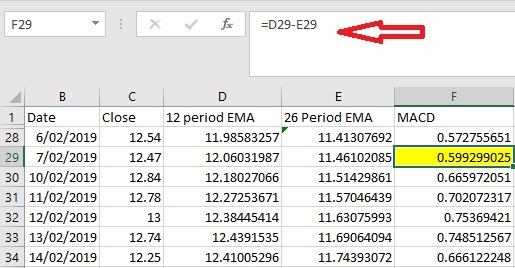
d) Once you have the values for the 12 day period EMA and the values for the 26 day period EMA, you subtract the 12 period EMA from the 26 day period EMA. Copy this formula down for all the dates needed.
This forms the MACD values which is one of the lines which will be plotted on a chart:
e) Next we need to find the values for the signal line which is the 9 day EMA of the MACD.
The first value of the 9 Day EMA of the MACD will be the averages of the first 9 MACD values.
The value in yellow for dates of 18/2/2019 is the average of all the values in green (below).

f) We use the same EMA formula to calculate the 9 day EMA using the values of the MACD
Using the date of 19/2/2019 as an example we have the below values:
EMA = (today’s closing price *K) + (Previous EMA * (1 – K))
K (Smoothing Factor) = 2/(N+1)
9 day EMA = (0.7187753 *(2/9+1) + (0.661607209 * (1-(2/(9+1)))
=0.6730408727
Use the excel formula below and copy down to calculate the signal data for all the dates.

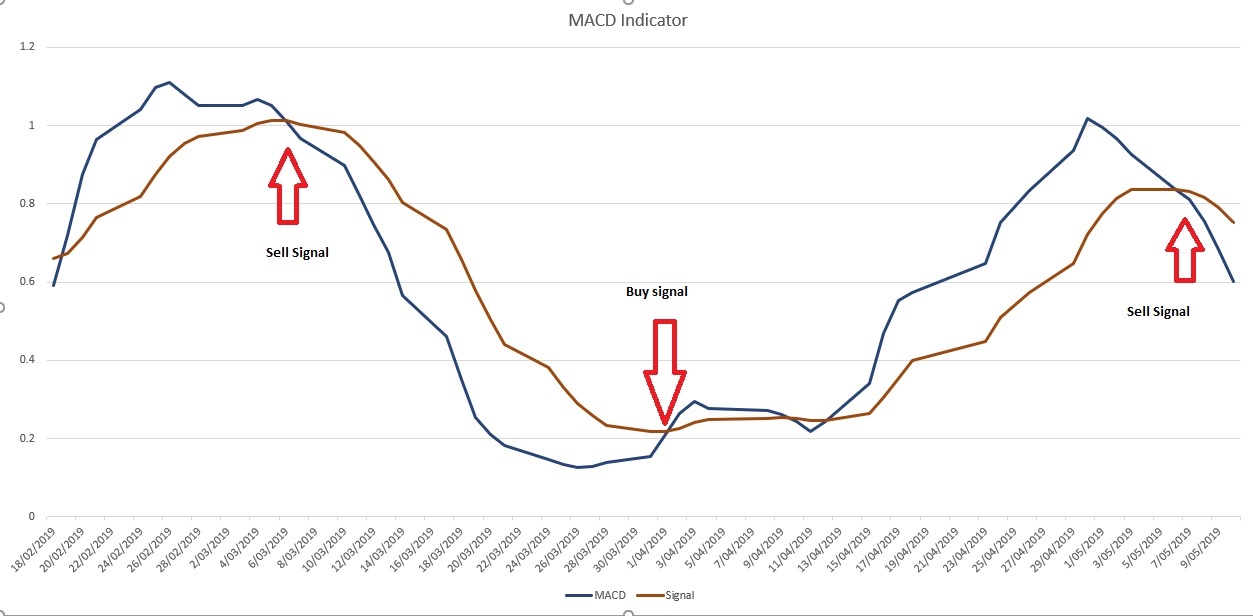
g) Once you have all data for the MACD and Signal column use the two columns of data and plot a line chart like below. This chart can provide sell and buy signals for traders.
How to read the MACD Indicator?
When the MACD crosses below the signal line then it is time to sell. This is a bearish sign.
When the MACD crosses above the signal line then it is time to buy the stock. This is a bullish sign.
Lauren Hua is a private client adviser at Fairmont Equities.
An 8-week FREE TRIAL to The Dynamic Investor can be found HERE.
Would you like us to call you when we have a great idea? Check out our services.
Disclaimer: The information in this article is general advice only. Read our full disclaimer HERE.
Like this article? Share it now on Facebook and Twitter!