

This post formed the basis of an article which then appeared in the Australian Financial Review on 16 February 2017. Michael Gable is a regular expert contributor to the AFR. You can access the AFR version HERE.
Trying to value resource companies can be notoriously difficult because of commodity price assumptions. Analysts tend to be too optimistic when stock prices have already peaked, and they tend to be too conservative once prices have already bottomed. The 12 month rally in stocks such as Fortescue Metals is an example of how following analyst’s price targets too closely could result in missing an opportunity. The solution to trading resource stocks is to pay much more attention to the price chart. You need to go with what the market is telling you, follow the momentum instead of what a broker’s 12 month target is on a stock.
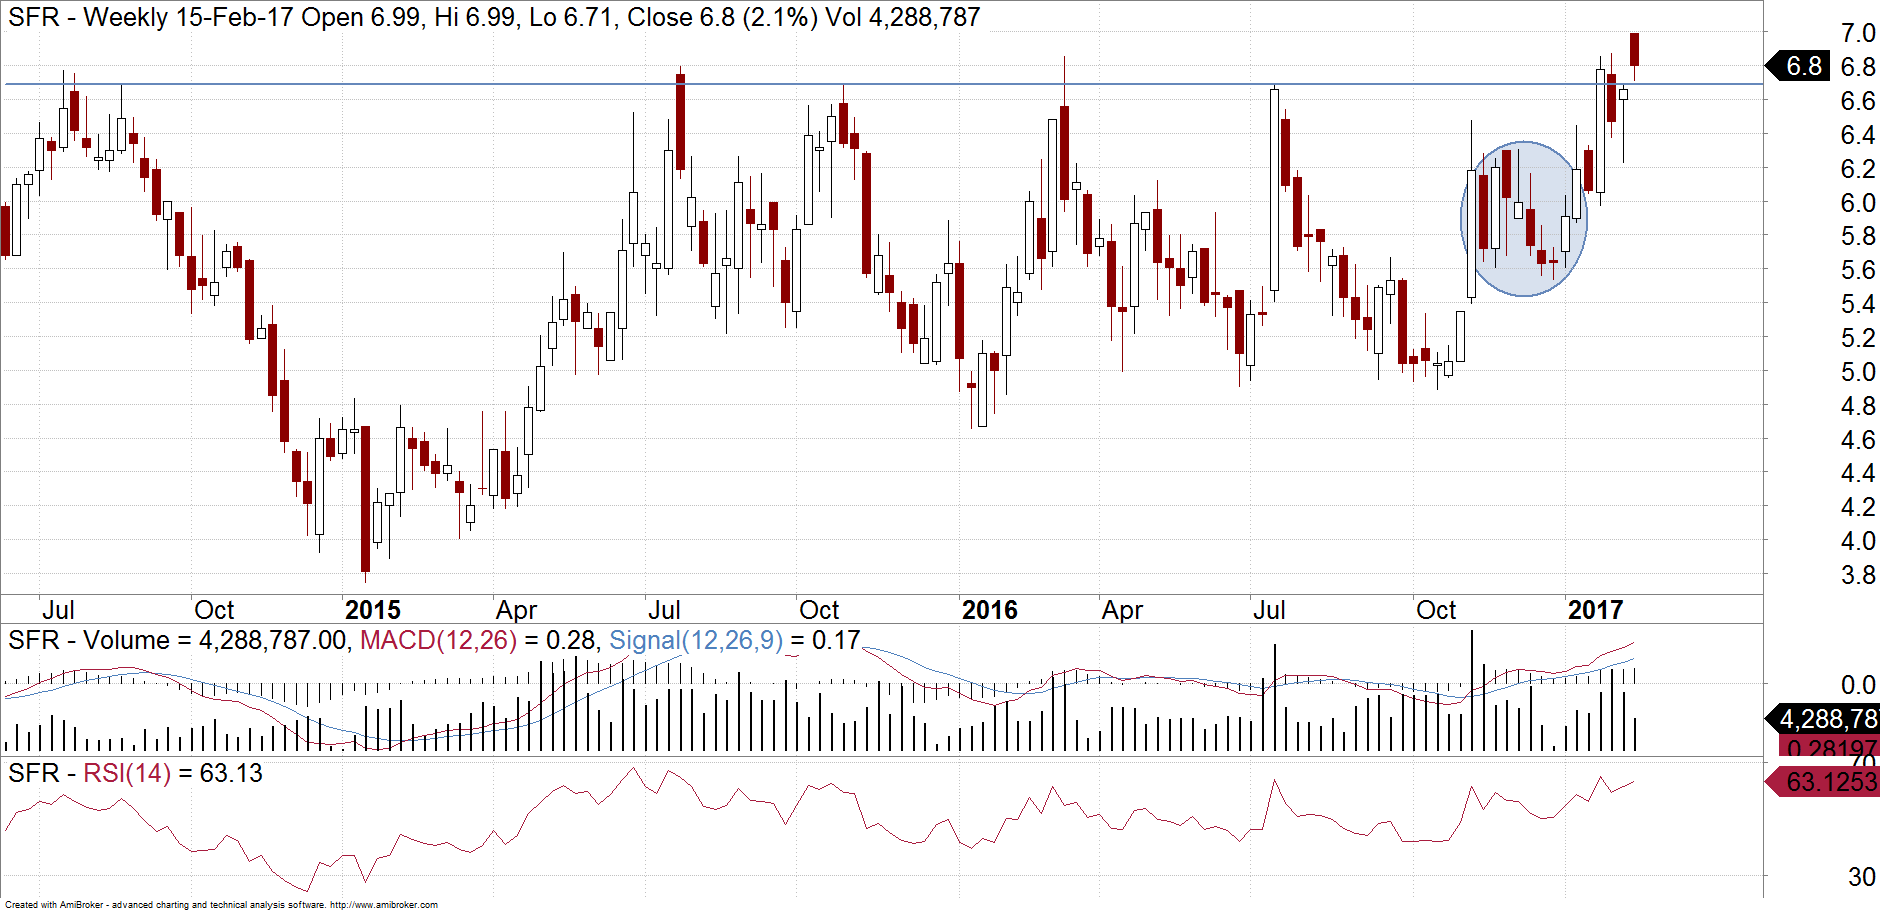
One commodity that has seen great gains recently is copper. Sandfire Resources is an Australian copper producer that is leveraged to this recent rally. Some analysts will say that the stock is overvalued but that depends on your guess as to where the price of copper will be this year. For the moment though, the stock is trading very well and the chart is showing a lot of bullish behaviour. This suggests we may see even more upside in the share price.
From its lows in 2015, Sandfire Resources rallied strongly from about $3.80 to an intraday high of $6.80 in the space of 6 months. It was the sold off from that level and spent the next year retesting that resistance zone another 3 times. When a stock rushes up to retest a previous high point or resistance level, it will often fail. To see a sustainable move, a stock needs to consolidate under that level first. It needs to weed out the sellers and get ready for the next move higher. By rushing up towards resistance those 3 times, it simply met a lot of selling pressure each and every time. Price action this time however is different. Towards the end of last year, Sandfire Resources pulled up short of this resistance level. It then tracked sideways for a while to flush out the sellers (circled on the chart). Once it broke out of that, it was free to push through that previously formidable resistance level near $6.80. Having pushed through that level this week, it is now establishing a new support zone to launch its next rally. If Sandfire Resources finds support here, then it is ready to move on to the next trading range. That should result in it trading much higher with the next resistance level not coming in until it is over $8.
Uniquely combining both Fundamental and Technical Analysis
Not yet a subscriber? Join now for FREE!
Receive our weekly tips and strategies into your inbox each week.
BONUS: Sign up now to download our 21 page Trading Guide.
Make sure you bookmark our main blog page and come back regularly to check out the other articles and videos. You can also sign up for 8 weeks of our client research for free! Otherwise you can email Michael Gable directly at michael@fairmontequities.com
Disclaimer: The information in this article is general advice only. Read our full disclaimer HERE.