
This post formed the basis of an article which then appeared in the Australian Financial Review on 3 June 2016. Michael Gable is a regular expert contributor to the AFR. You can access the AFR version HERE.
In being an energy retailer as well as a gas and oil producer, should Origin be better sheltered by the drop in oil prices? Lower oil prices have sent the share prices of energy companies lower, but what if the company is as diversified as Origin? Part of the business acts like a utility and part of it is exposed to LNG production. The share price is trading ahead for the calendar year so far. Much of it can be attributed to a rising oil price. However, despite calls of the oil price now momentarily looking “toppy” we can see signs of the market not wanting to take its profits yet. The chart for Origin is actually indicating that further upside may be in store for the next few months.
It is almost impossible to identify a low when you are there, but once you let some time pass, it starts to become more obvious. The trick is ensuring you are identifying it while there is still enough upside left on the table. From current levels, we can see about 30 per cent upside in the share price over the next several months. Its a big call in comparison to consensus targets, but this is what I can see on the chart. And looking at charts alongside company fundamentals is an essential tool for successful investing.
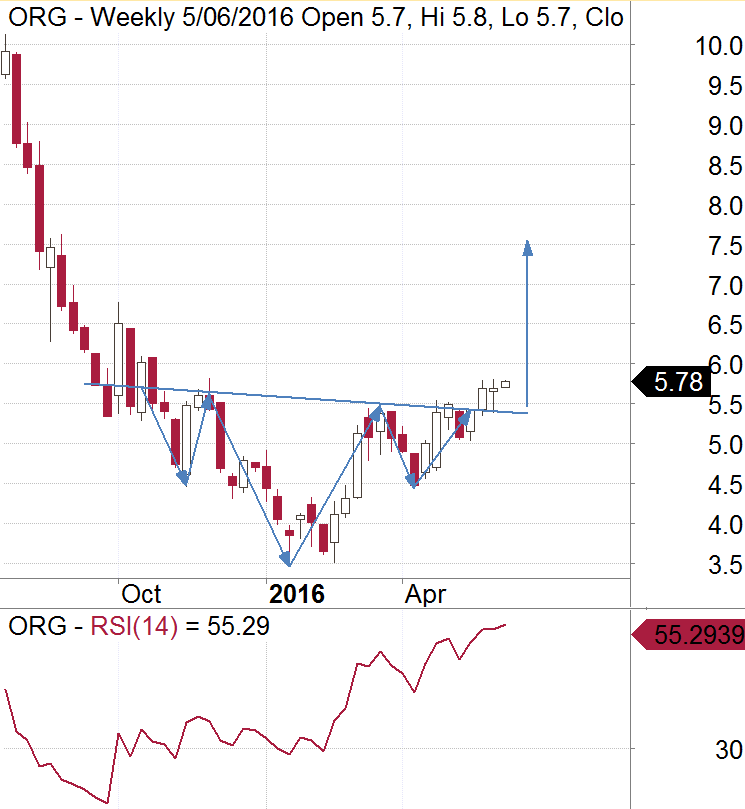
Firstly we have now seen an “inverse head and shoulders” form on the weekly candlestick chart. This is a typical reversal signal in technical analysis. It is identified by a low point (the head) and a test of the low either side of it (to form the shoulders). I have drawn this in with some arrows. Volume needs to be decreasing throughout (which it has). Once the neckline is broken (indicated by the horizontal line), the stock will usually then move in a distance equal to that of the neckline and the head. In this case the distance is about $2. If we extrapolate that to a target, it takes us to the mid $7’s. The other point of interest is the Relative Strength Index (RSI) which is at the bottom of this chart. You will notice that it found a low last year and has been trending higher ever since. This is also a positive sign for Origin and an indication that momentum is also on our side.
These patterns can be very powerful. The last time we saw an inverse head and shoulders was on the ASX 200 a few months ago as it traded under 5000. At the time we extrapolated a rally to well above 5300. At the moment we are betting that history is about to repeat with Origin.
Make sure you bookmark our main blog page and come back regularly to check out the other articles and videos. You can also sign up for 4 weeks of our client research for free!
Disclaimer: The information in this article is general advice only. Read our full disclaimer HERE.